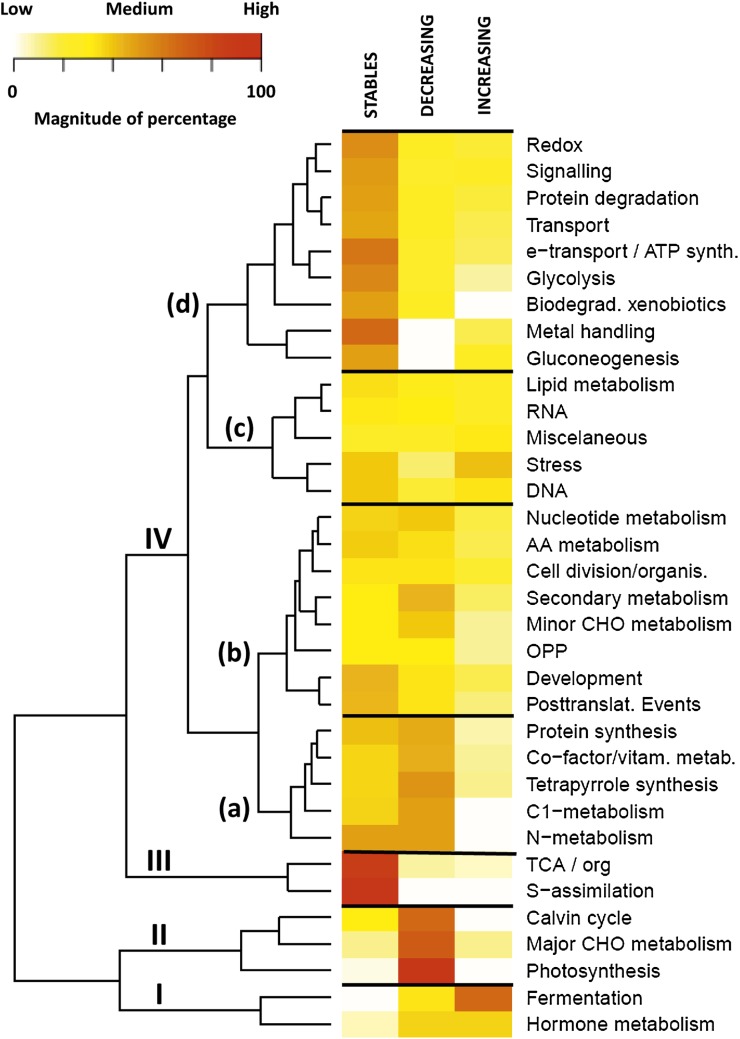
Figure 9.
Heatmap showing the percentage of proteins of each functional class according to the abundance pattern. The three abundance patterns considered during the differentiation of chromoplasts are: stable, decreasing, and increasing. The magnitude of the percentage is represented by a color scale (top left) going from low (white), to medium (yellow), and high (red).

