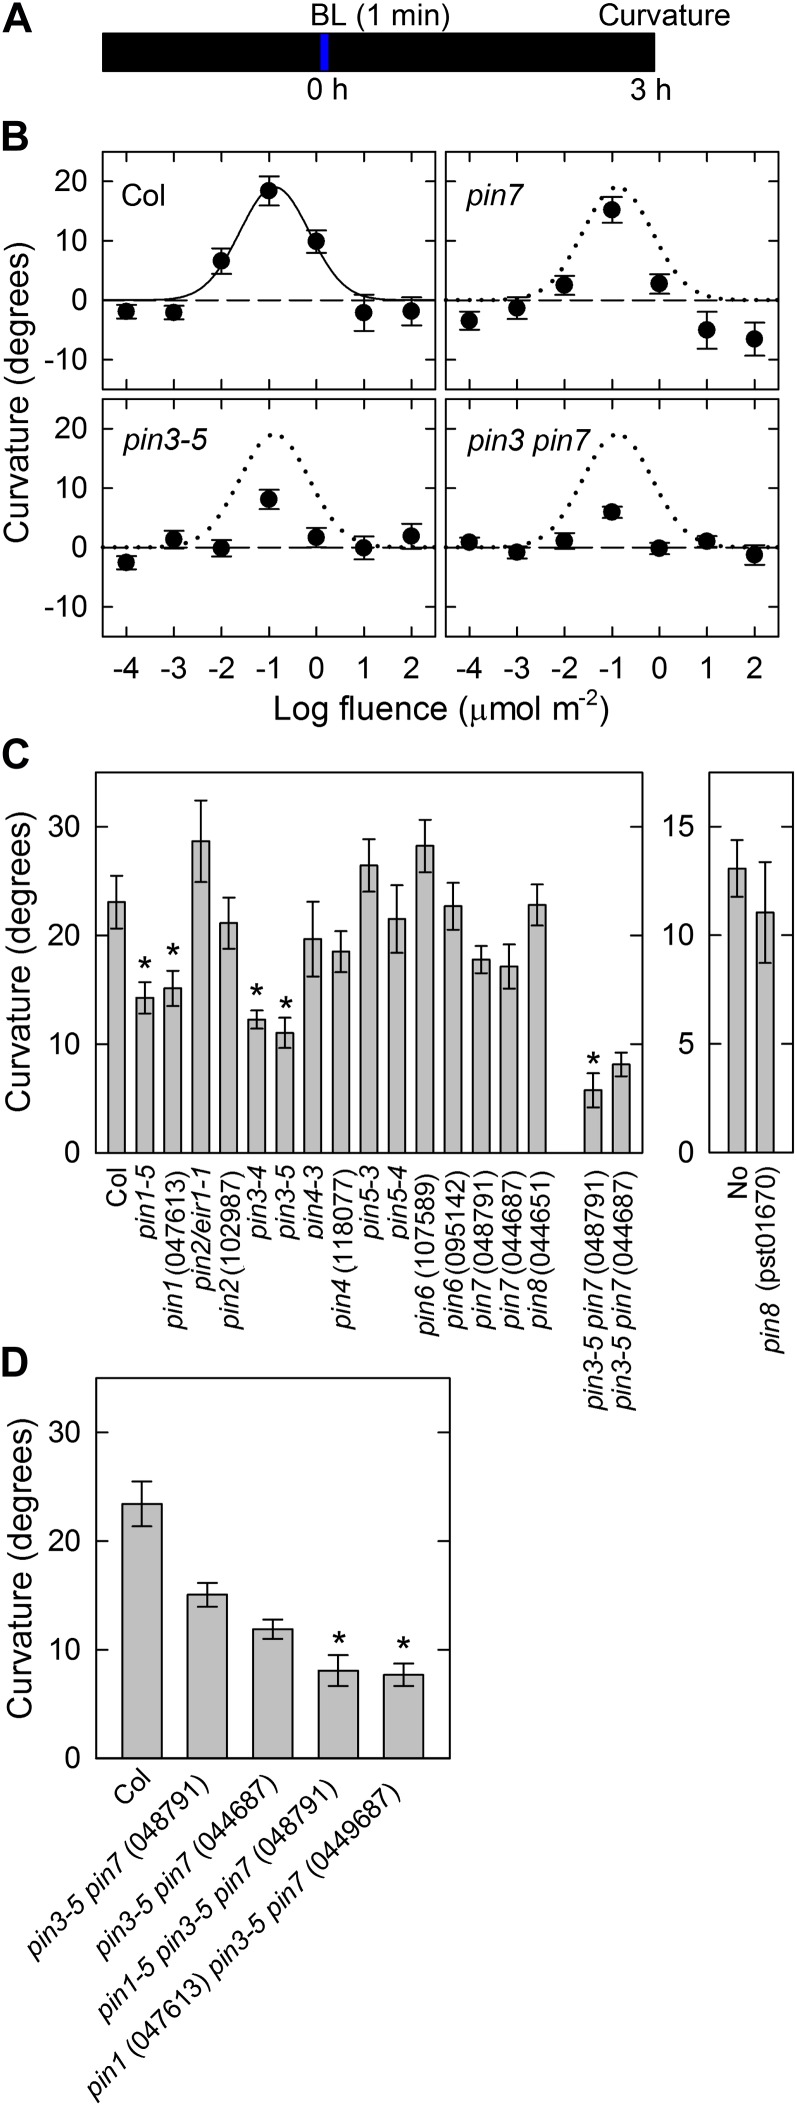
Figure 2.
Pulse-induced hypocotyl phototropism in dark-grown seedlings. A, Experimental scheme for phototropism. Hypocotyls were stimulated with unilateral blue light for 60 s, and curvatures were determined 3 h after the onset of stimulation. B, Fluence-response curves for pulse-induced phototropism. Hypocotyls were stimulated with unilateral blue light at various fluences. The data shown are the means ± se from 16 seedlings. The fitted curve obtained from Columbia (Col) data (solid line) was reproduced as dotted lines for comparison. C, Pulse-induced phototropism in pin mutants. The hypocotyls were stimulated with unilateral blue light at the optimal fluence (0.1 μmol m−2). The data shown are the means ± se from 15 to 22 seedlings. The asterisk shows a statistically significant difference between the wild type and pin mutants (Student’s t test, P < 0.05). In the case of pin3 pin7 double mutants, statistical analysis was conducted between pin3-5 and the double mutants. D, Pulse-induced phototropism in pin1 pin3 pin7 triple mutants. The hypocotyls were stimulated with unilateral blue light at the optimal fluence. The phototropic curvatures of segregated pin3 pin7 double mutants were also analyzed. The data shown are the means ± se from 14 to 17 seedlings. The asterisk shows a statistically significant difference between the segregated pin3 pin7 double mutants and the pin1 pin3 pin7 triple mutants (Student’s t test, P < 0.01).

