Figure 3.
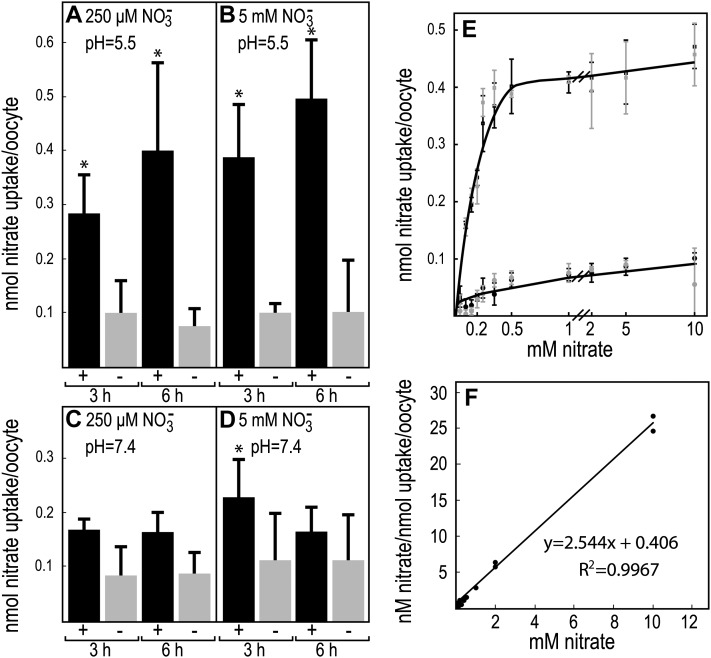
Nitrate uptake in X. laevis oocytes expressing MtNIP/LATD. Oocytes were microinjected with MtNIP/LATD mRNA (black bars, +) or water as a negative control (gray bars, −), incubated for 3 d, and then placed for the indicated times in medium containing 250 μm or 5 mm NO3− at pH 5.5 or 7.4. The oocytes were rinsed, lysed, and assayed for NO3− content. A and C, Treatment with 250 μm NO3−. B and D, Treatment with 5 mm NO3−. A and B, pH = 5.5. C and D, pH = 7.4. Data are shown for one biological replicate ± sd (n = 3–5 batches of 4–6 oocytes per batch). Asterisks mark NO3− uptake significantly different from the negative control, using Student’s t test at P < 0.05. Similar results were obtained in more than five repetitions of the experiment. E, Michaelis-Menten plot of oocyte NO3− uptake. MtNIP/LATD-injected oocytes (squares) or water-injected oocytes (circles) as control were incubated for 3 h in 50 μm to 10 mm NO3− in batches of five and assayed for NO3− uptake. Results for two biological replicates are indicated by the black and gray symbols, with error bars showing sd. All NO3− uptake was significantly different from the negative control, using Student’s t test at P < 0.05, except for that at 50 μm. F, Hanes-Woolf plot of averaged NO3− uptake data, in MtNIP/LATD-injected oocytes minus water-injected oocytes, presented in E. These data were used to calculate the Km of 160 μm.

