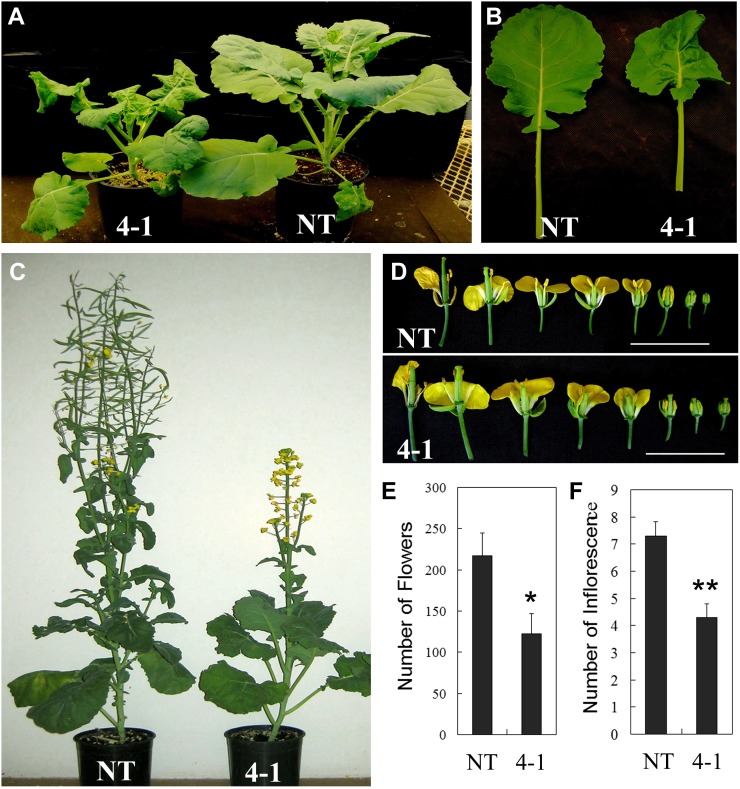
Figure 2.
Morphological alteration exhibited by the tt16 down-regulated canola line. A, Dwarf phenotypes of 40-d-old tt16 RNAi transgenic lines. B, Leaves of 40-d-old transgenic lines. C, Delayed flowers of 70-d-old tt16 RNAi transgenic lines. D, Flowers of 70-d-old transgenic lines. E, Number of flowers and inflorescences in 70-d-old tt16 RNAi transgenic lines. 4-1, tt16 RNAi transgenic line 4-1. sd (n = 3) is indicated by vertical bars. Single and double asterisks indicate significant differences between transgenic and NT plants with P < 0.05 and P < 0.01, respectively, as determined by t test.

