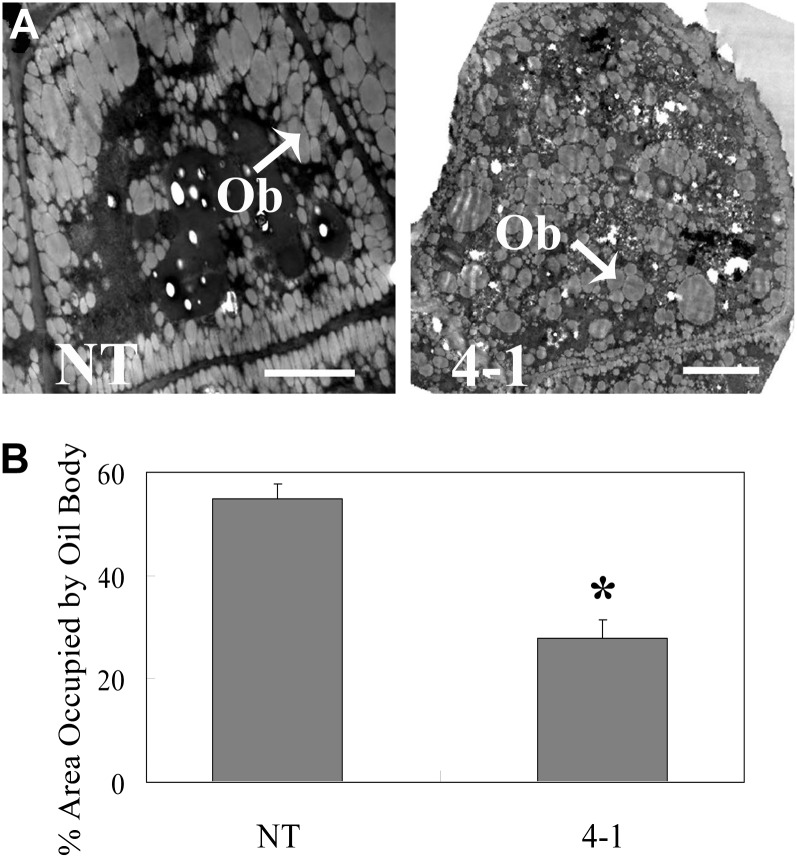
Figure 6.
Transmission electron microscopy observation of hypocotyl cells (34 DAF) in tt16 RNAi transgenic lines. A, Transmission electron microscopy observation of hypocotyl cells. Ob, Oil bodies. Bars = 2.5 μm. B, Quantitation of the area occupied by oil bodies. The percentage area occupied by oil bodies was determined using ImageJ software (http://rsbweb.nih.gov/ij/). se values (n = 3) are indicated by vertical bars. The single asterisk indicates a significant difference between transgenic and NT plants with P < 0.05 as determined by t test. 4-1, tt16 RNAi transgenic line 4-1.

