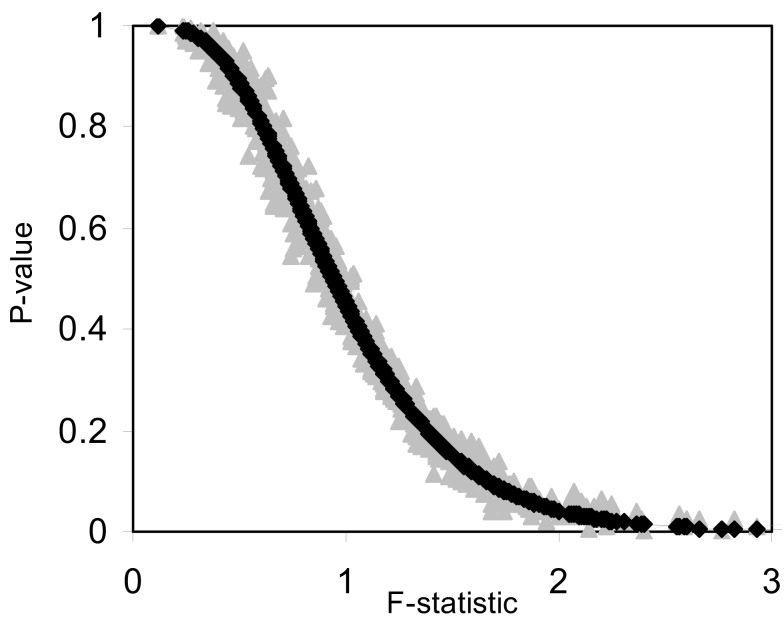
Figure 3.
Plot of permutation test-derived p-values as a function of the F-statistic in gray, the corresponding p-values derived from the F-distribution are overlaid in black for 10 samples (N = 10) and 10 random variables (P = 10) following a normal distribution with a mean of 0 and a variance of 1 simulated 1000 times. Five samples were coded as control (0) and five samples were coded as experiment (1).

