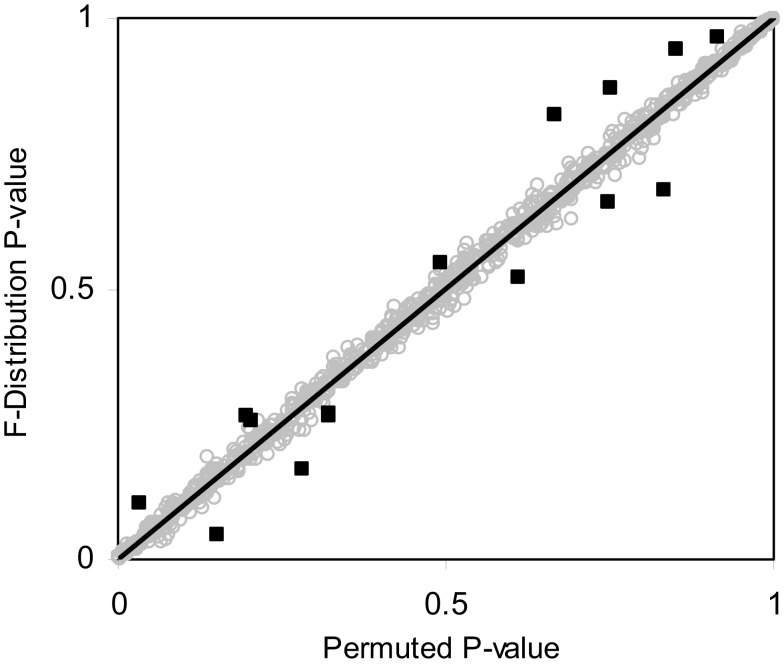
Figure 4.
Scatter plot of p-values obtained from the F-distribution vs. permutation tests for random samples sizes varying between 4 and 100 (i.e., 4 ≤ N ≤ 100) and random variables size from 1 to 100 (i.e., 1 ≤ P ≤ 100) with a single continuous regressor variable (M = 1) simulated 1000 times. Outlying observations represented as black squares lying away from the trend line have sample sizes less than or equal to eight.

