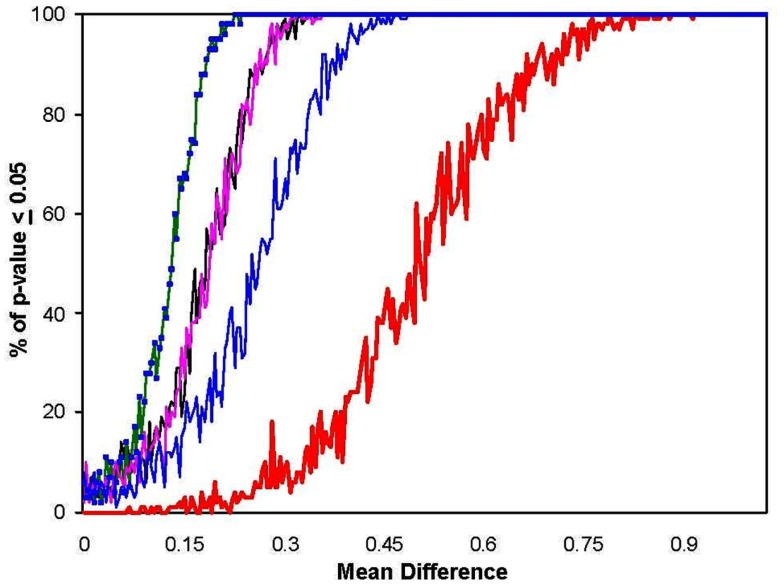
Figure A1.
Power of the MDMR procedure as a function of non-normal population distributions. The black line shows power as calculated before for two populations with normal distributions. The green line displays power for populations with log normal distributions. The pink line shows power for power for populations with bimodal distributions (equivalent for a normal distribution with 100% of the data having means altered) and the blue line shows power when only one mode of a bimodal population is different (equivalent for a normal distribution with 50% of the data having means altered). The red line shows the power of a Bonferroni corrected p-value for the Student’s t-tests performed on each of the 100 variables in univariate t-tests which were corrected for the 100 statistical tests pursued.

