Figure 1.
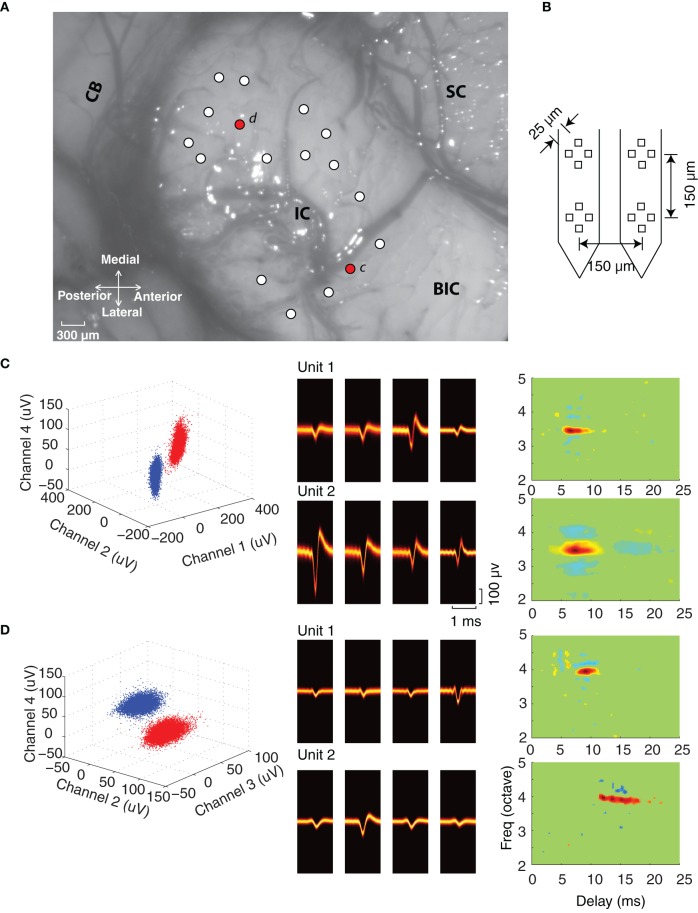
Experiment configuration and single unit isolation. (A) The dorsal–lateral surface of the exposed IC in one experiment along with the surrounding neural structures (SC, superior colliculus; BIC, brachium of the inferior colliculus; CB, cerebellum). Electrode penetrations are marked by circles (white and red) and were orientated an angle of 30° relative to the sagittal plane (roughly orthogonal to the frequency-band lamina). (B) Four-tetrode array used for the neural recordings. (C,D) Single unit isolation in two tetrode recordings. Each site has two well-isolated units as noted by the peak waveform amplitudes clusters at selected tetrode channels (blue and red clusters, left). The spike waveform density plots (middle) on each of the tetrode channels are shown for each of the isolated units. The waveform density represents the probability that the action potentials recorded on a given channel follow a particular waveform trajectory (color represents probability; orange is high, black is low), thus highlighting the most likely waveform pattern for each channel. Spectrotemporal receptive fields (STRF) are shown for each of the isolated units on the far right.

