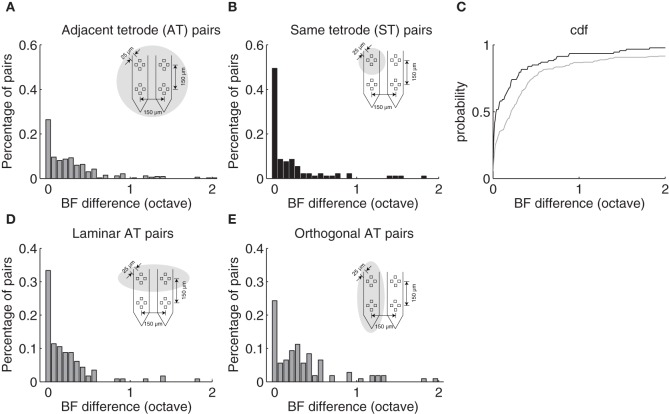
Figure 3.
Best frequency differences between neighboring neurons depend on proximity. (A) BF difference distribution for neuron pairs isolated on adjacent tetrodes (AT) with a separation of 150 μm as illustrated in Figure 1B. Eighty percent of AT pairs fall within 0.55 octave. (B) The distribution of BF differences for neuron pairs isolated on the same tetrode (ST) are largely confined to 0.32 octave (80%). (C) BF difference cumulative distribution function for same (black) and adjacent (gray) tetrode neuron pairs. (D) BF difference distribution for neuron pairs isolated on adjacent tetrodes that are along the ICC lamina orientation. (E) The distribution for neuron pairs isolated on adjacent tetrodes that are orthogonal to the lamina orientation. A significant mode is observed at ~0.28 octave consistent with the average BF difference between adjacent laminae.

