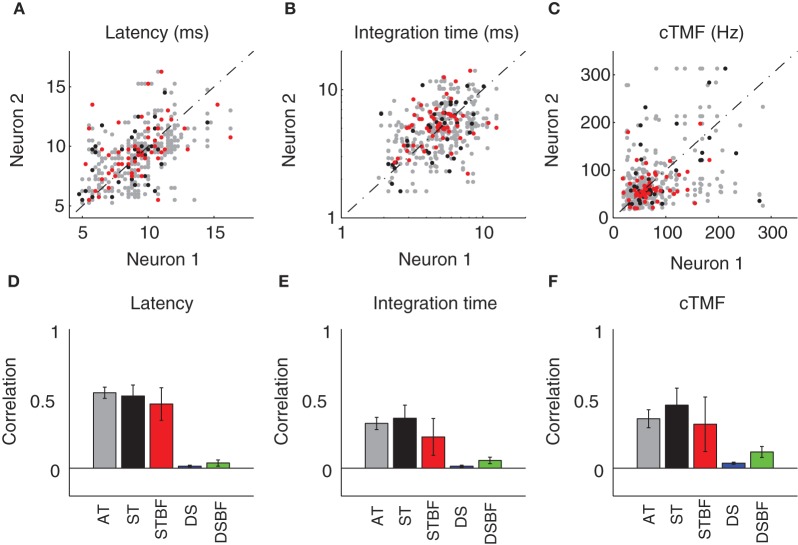
Figure 5.
Neighboring ICC neurons share similar temporal preferences. (A–D) Scatter plots showing the temporal STRF parameters (A, Latency; B, Duration; C, cTMF) of neighboring single units (neuron 1 and 2). The data was partitioned into three experimental groups as in Figure 4 (AT, gray; ST, black; STBF, red). The Pearson correlation coefficient was used to compare the similarity for each of the temporal parameters between neighboring neurons. The correlation coefficient is shown for each of the experimental groups as well as for two reference controls (DS, blue; DSBF, green). Statistics for the temporal parameter comparisons are provided in Table 2. The error bars in D–F represent the bootstrapped SE of the correlation coefficient.

