Fig. 2.

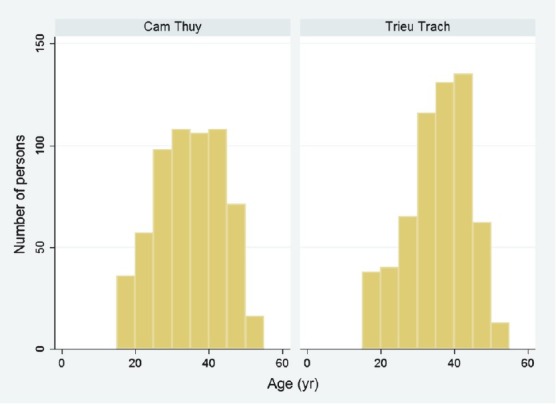
The age distribution in the two study areas, Cam Thuy (more developed community, n = 600) and Trieu Trach (less developed community, n = 600).

The age distribution in the two study areas, Cam Thuy (more developed community, n = 600) and Trieu Trach (less developed community, n = 600).