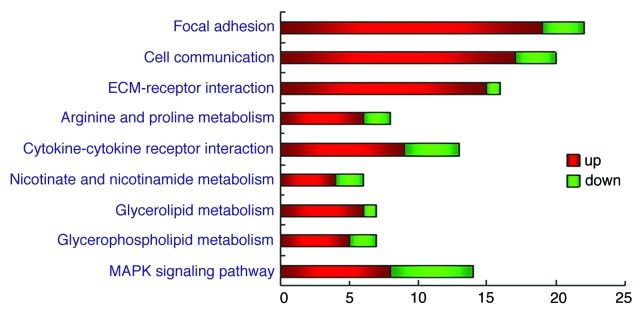
Figure 4. Distinct altered genes in certain pathways. Differentially expressed genes are classified into pathways dealing with molecular function, biological processes and cellular components. Each bar indicates the number of the genes involved in the certain pathway. Changes of the expression levels are illustrated using color coding, the key to the color code is shown on the right. The p-value < 10−4 was used as a cut-off.

An official website of the United States government
Here's how you know
Official websites use .gov
A
.gov website belongs to an official
government organization in the United States.
Secure .gov websites use HTTPS
A lock (
) or https:// means you've safely
connected to the .gov website. Share sensitive
information only on official, secure websites.
