
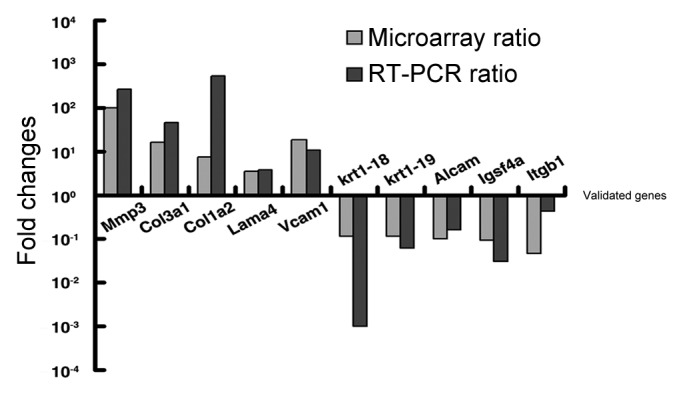
Figure 5. Validation of 10 candidate genes by real time PCR. Fold induction or repression of 10 genes associated with cell migration and invasion of Gadd45a+/+ cell, as compared with Gadd45a−/− cell. The gray bars indicate the fold changes in microarray analysis; the black bars indicate the fold changes in real-time PCR validation. The ratios are normalized by logarithm.