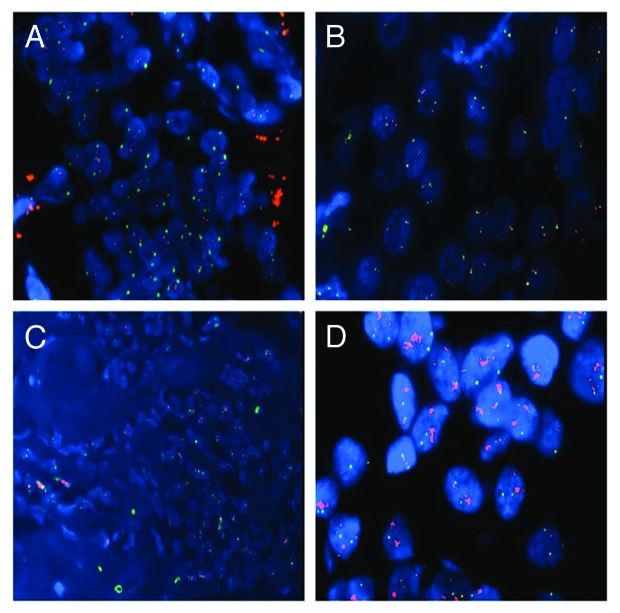
Figure 4. FISH analysis for the detection of EGFR amplification. (A) An OSCC showing euploid chromosome 7 and not amplified EGFR; (B) a case of OSCC showing triploid chromosome 7 and three copies of EGFR; (C) a case of OSCC demonstrating aneuploidy at chromosome 7 and multiple copies of EGFR (polysomic not amplified EGFR); (D) a case of OSCC showing euploid chromosome 7 and multiple copies of EGFR visualized as nuclear clusters (amplified EGFR gene) [FISH: LSI EGFR Dual-Color Probe-Hyb Set, LSI EGFR Spectrum Orange/Cep-7 Spectrum Green; DAPI II (4,6-diamino-2-phenyindole-2-hydrochloride) was used for chromatin counterstaining; a ratio of LSI EGFR Spectrum Orange/Cep-7 Spectrum Green >2 has been considered as amplified; for further details see Materials and Methods].

An official website of the United States government
Here's how you know
Official websites use .gov
A
.gov website belongs to an official
government organization in the United States.
Secure .gov websites use HTTPS
A lock (
) or https:// means you've safely
connected to the .gov website. Share sensitive
information only on official, secure websites.
