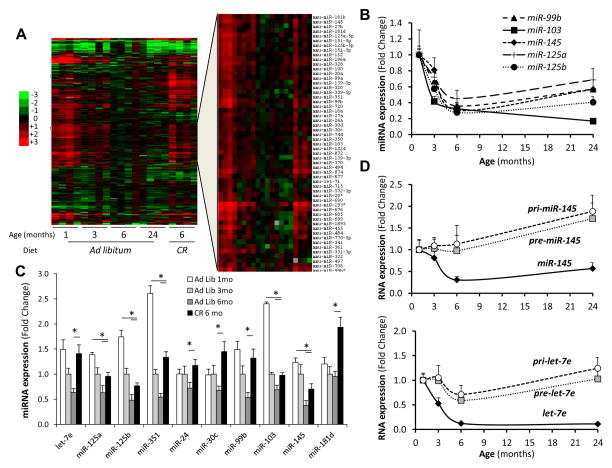
Figure 1. Regulation of miRNA Expression in Adipose Tissue in Response to Age and Calorie Restriction (CR).
See also Figure S1 and Tables S1 and S6.
(A) Heat map representing the quantitation of 265 miRNAs expressed in the subcutaneous adipose tissue of mice at 1, 3, 6 and 24 months of age and at 6 months of age after 3 months of a 40% CR.
(B) and (C) Quantitation of selected miRNAs by SYBR-Green stem-loop PCR in subcutaneous fat of aged and calorie restricted mice. n=4–5 per group.
(D) RT-qPCR of the pri-, pre- and mature miR-145 and let-7e was performed as described in Experimental Procedures. n=5 per group.
* P < 0.05. Error bars, SEM. Ad Lib, Ad libitum. mo, months.

