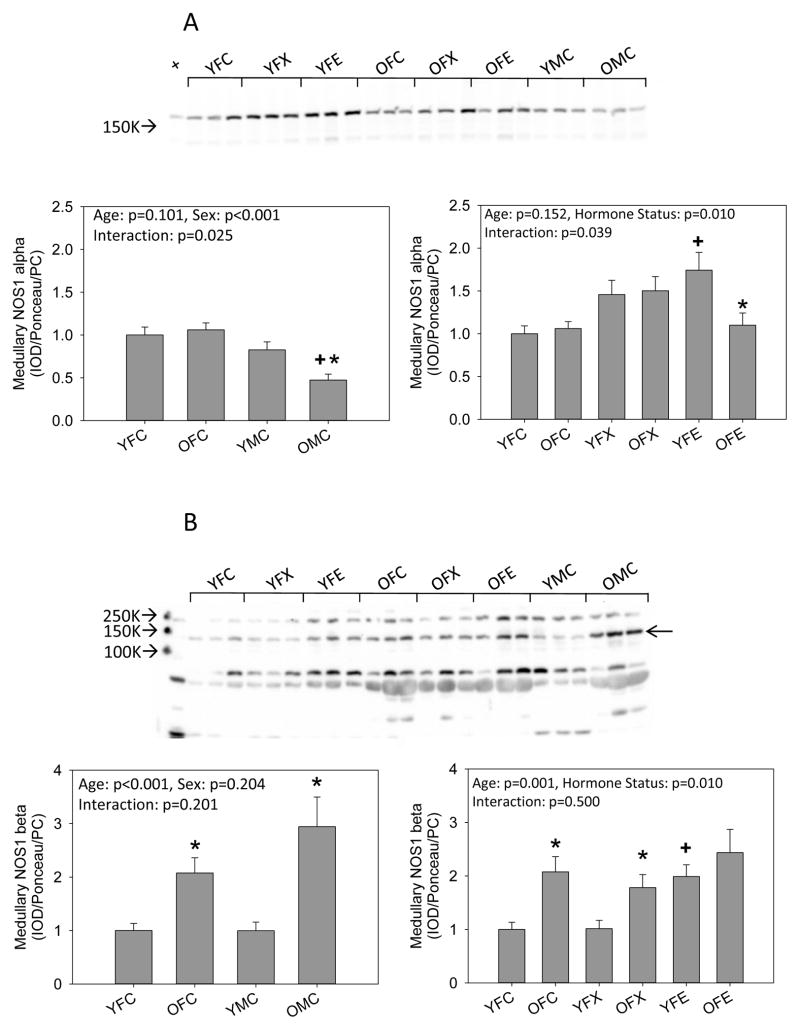
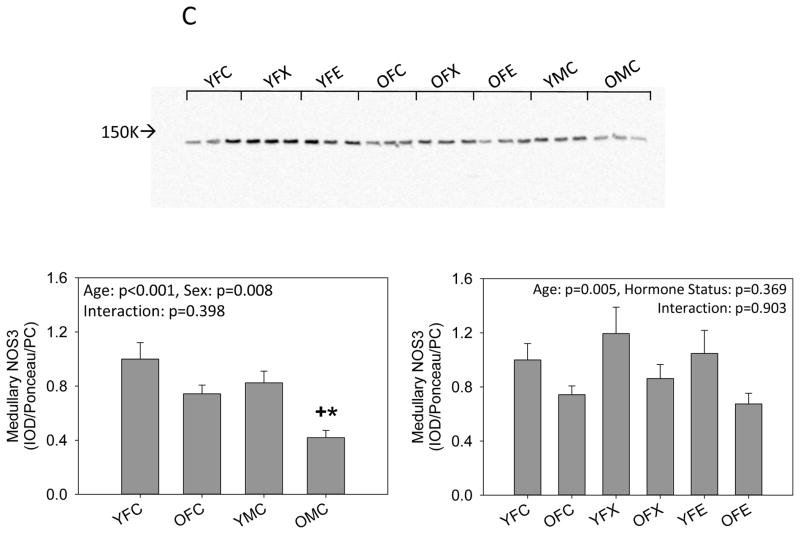
Figure 3.
Western blot analysis of (A, B) neuronal NOS (NOS1) isoforms and (C) endothelial NOS (NOS3) in the kidney medulla from young (Y) and old (O), female (F) and male (M) F344 rats. Control (C) rats were gonad intact, and some females were ovariectomized (X) with or without estrogen replacement (E). + = positive control on representative blot. Arrow on Panel B indicates NOS1 beta specific band. n=6, * = p<0.05 vs respective young rat, + = p<0.05 vs intact female of same age.


