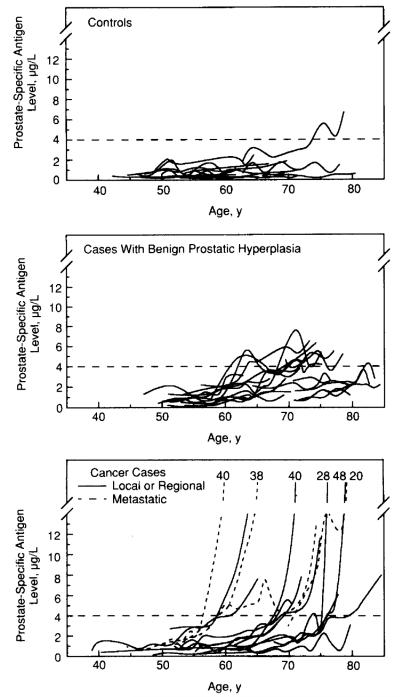
Fig 1.
Observed data on prostate-specific antigen (PSA) levels μg/L) plotted as a function of age for each individual in the three diagnostic groups (solid lines). The broken horizontal line marks the single PSA criterion of 4.0 μg/L The PSA values at visit closest to diagnosis are indicated for individuals who progress beyond a PSA value of 14 μg/L.

