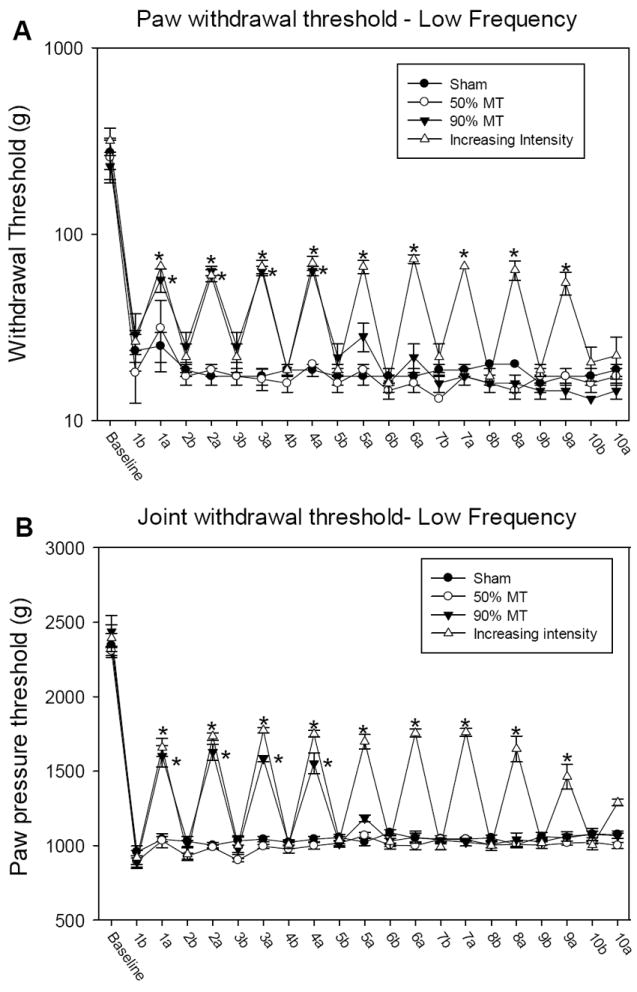
Figure 3.

Graph representing mechanical withdrawal threshold of the paw (A) and knee joint (B) in animals that received low frequency TENS. Mechanical withdrawal thresholds are illustrated prior to induction of inflammation (baseline), before (b), and after application of TENS (a). Data are represented as means ± SEM. *Significantly different between before and after TENS stimulation (p<0.005).
