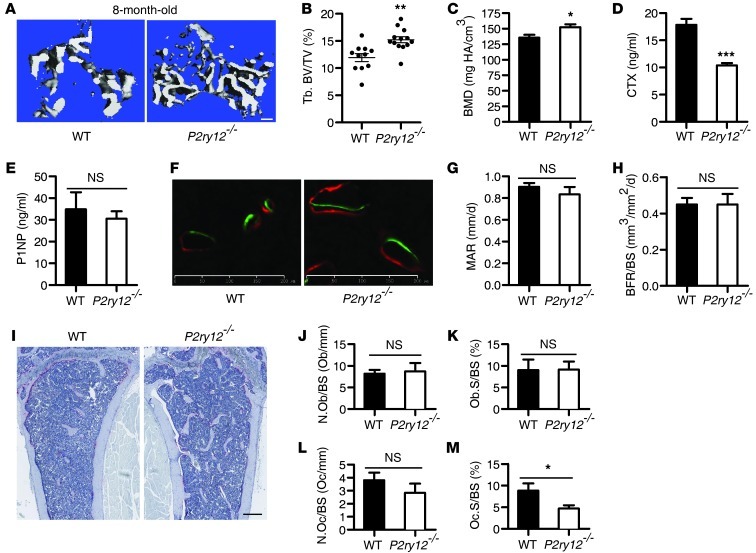
Figure 1. P2ry12–/– mice were protected from age-associated bone loss.
(A–C) The primary and secondary spongiosa of the tibias of age- and sex-matched WT and P2ry12–/– littermate mice were analyzed by μCT scanning. (A) Representative 3D reconstructions of trabecular bone. Scale bar: 200 μm. (B) Calculation of BV/TV and (C) BMD. Tb, trabecular bone. (D and E) Serum concentration of CTX and P1NP measured by ELISA. (F) Bone formation was visualized by calcein (first) and alizarin red (second) double-labeling and visualized in the trabecular bone. Scale bars: 200 μm. MAR and BFR are shown (G and H). Bone histology, representative TRAP staining (I). Scale bar: 300 μm. (J–M) Quantification of OB and OC cells in the primary and secondary spongiosa of the femur. OC number and OC surface per bone surface, OB number and OB surface per bone surface are shown. Data represent mean ± SD. n = 6. *P < 0.05; **P < 0.01; ***P < 0.001.

