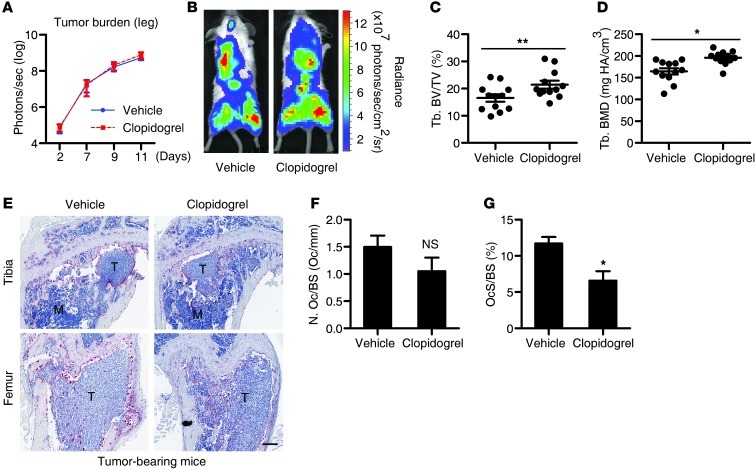
Figure 6. Pharmacologic inhibition of P2RY12 protected mice from tumor-associated bone loss.
4T1-GFP-FL tumor cells were directly injected into the left cardiac ventricle of WT Balb/c mice (n = 12 per group). Clopidogrel treatment (30 mg/kg/d in drinking water) was begun 2 days after tumor cell injection and continued for 9 days. (A) The tumor burden in hind limbs measured by BLI and (B) representative pictures of BLI at day 11. (C and D) BV/TV and BMD of the tibia of tumor-bearing mice at day 11 were analyzed by μCT. (E) TRAP-stained hind limb sections at day 11 after tumor injection and vehicle or clopidogrel treatment. TRAP+ staining (dark red areas) indicates OC presence. Scale bar: 300 μm. OC number and surface in the primary and secondary spongiosa of the tibia are shown (F and G). Data represent mean ± SD. *P < 0.05; **P < 0.01.

