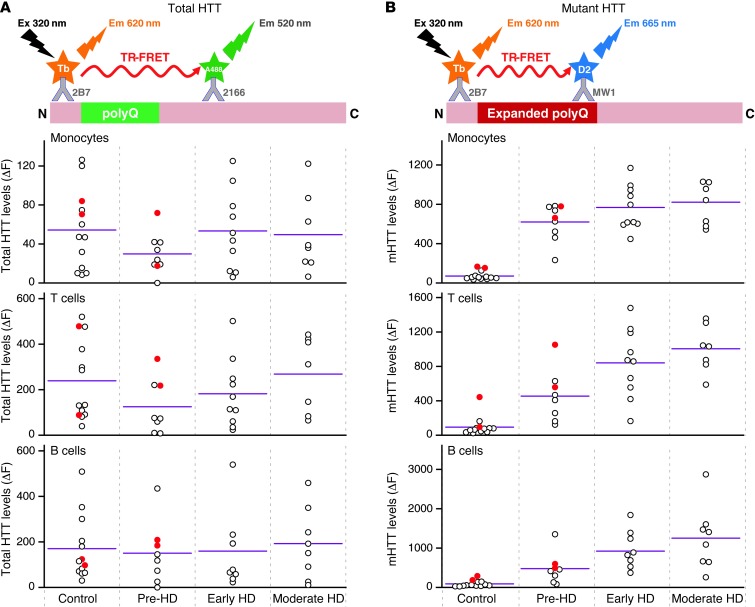
Figure 1. Relationship between HTT levels in peripheral immune cells and disease stage.
Total HTT and mHTT protein levels were quantified by TR-FRET in monocytes, T cells, and B cells. Total HTT quantification relies on simultaneous binding of 2B7 and 2166 anti-HTT antibodies. mHTT is quantified using the 2B7 antibody and a polyglutamine-specific antibody, MW1. (A) Total HTT levels in leukocytes showed no significant differences between patients with HD and control subjects or between HD gene carriers at different disease stages. (B) mHTT protein was detected in samples from patients with HD and pre-manifest HD mutation carriers, as compared with that in controls. Differences in mean mHTT levels in leukocytes were observed between pre-manifest and manifest HD patients (P < 0.01) and between pre-manifest and early-stage HD subjects (P = 0.051 and P < 0.05 for monocytes and T cells/B cells, respectively). Colored circles indicate multiple samples from a single subject. White circles indicate samples from individual subjects. Horizontal bars indicate the mean. Em, emission; Ex, excitation; N, N-terminal; C, C-terminal; Tb, terbium cryptate; polyQ, polyglutamine tract; pre-HD, pre-manifest HD sample; Early HD, early-stage HD sample; Moderate HD, moderate-stage HD sample.

