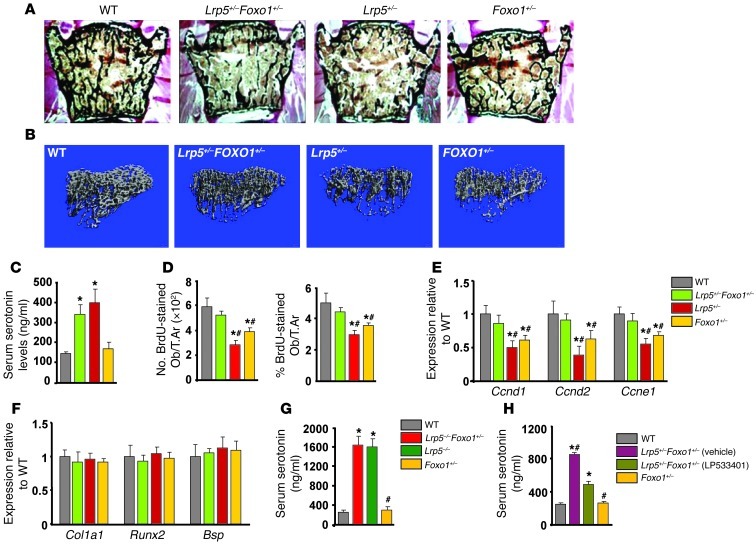
Figure 1. Foxo1 haploinsufficiency rescues the low bone formation phenotype of Lrp5+/– mice.
(A) Representative vertebral section images from 2-month-old mice. Mineralized bone matrix is stained in black by Von Kossa reagent. Original magnification, ×4. (B) Representative 3D images of transverse CT slices of proximal tibia obtained by high-resolution μCT analysis. (C) Serum serotonin levels (n = 4 mice/group). (D) Osteoblast proliferation as the number of BrdU-stained osteoblasts (Obs) per trabecular area (T.Ar.) or as the percentage of total osteoblasts per trabecular area (n = 6 mice/group) in sections of femurs. (C and D) *P < 0.05 versus WT, #P < 0.05 versus Lrp5+/–Foxo1+/– group. (E and F) Real-Time PCR analysis of indicated genes in bone (n = 6 mice/group). *P < 0.05 versus WT, #P < 0.05 versus Lrp5+/–Foxo1+/– group. (G) Serum serotonin levels (n = 4 mice/group). *P < 0.05 versus WT, #P < 0.05 versus Lrp5–/–Foxo1+/– group. (H) Serum serotonin levels in WT, Lrp5+/–Foxo1+/–, and LP533401-treated Lrp5+/–Foxo1+/– mice. The gut-derived serotonin synthesis inhibitor LP533401 was administered as indicated at 200 mg/kg/d by oral gavage for 4 weeks. Mice were 2 months old (n = 6 mice/group). *P < 0.05 versus WT, #P < 0.05 versus LP533401-treated Lrp5+/–Foxo1+/– group.

