Fig. 6.

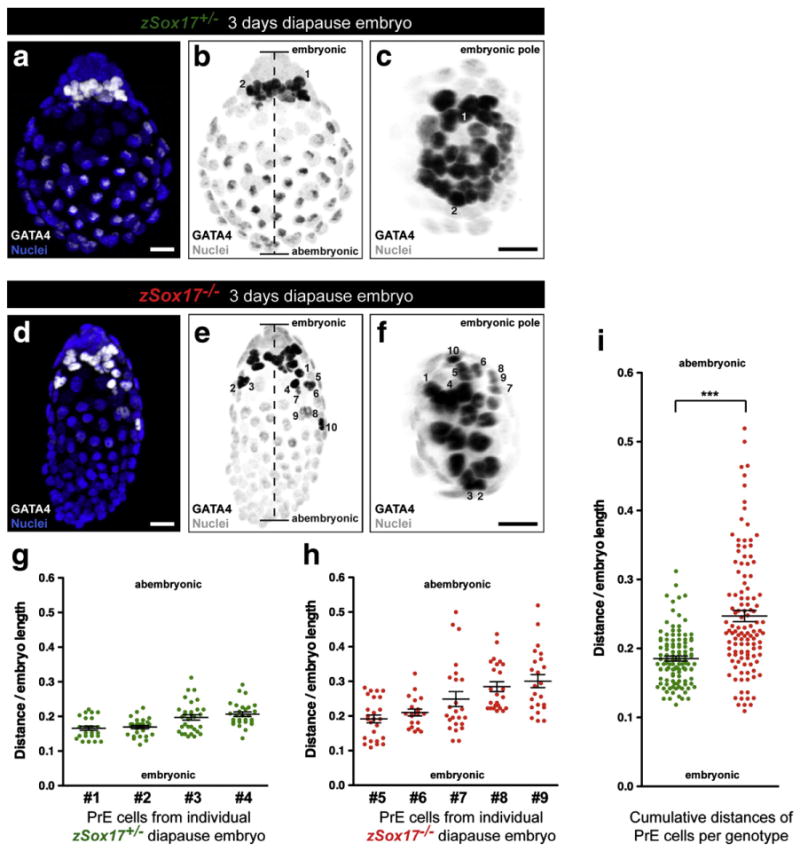
Premature migration of PrE cells along mural trophectoderm in implantation delayed Sox17 mutant blastocysts. (a, d) Immunodetection of GATA4 (white) in 3 day implantation-delayed Sox17+/− (a) and Sox17−/− embryos (d). Nuclei were counterstained with Hoechst (blue). (b, e) Greyscale conversion of (a) and (d) respectively. Dashed line defines the length between the embryonic and abembryonic poles. (c, f) View from the embryonic pole of (b) and (e) respectively. GATA4-positive nuclei from PrE cells (dark, number) can be tracked and located according to these two views. (a–f) Scale bars: 20 μm. (g) Average and relative distances to the proximal embryonic region of the PrE cells in 4 individual Sox17+/− (green) embryos. (h) Average and relative distances to the proximal embryonic region of the PrE cells in 5 individual Sox17−/− (red) embryos. (i) Combined average and relative distances of PrE cells in all analyzed Sox17+/− (green) and Sox17−/− (red) embryos. (***: significant statistical t-test with a p<0.0001). (g–i) Error bars indicate s.e.m.
