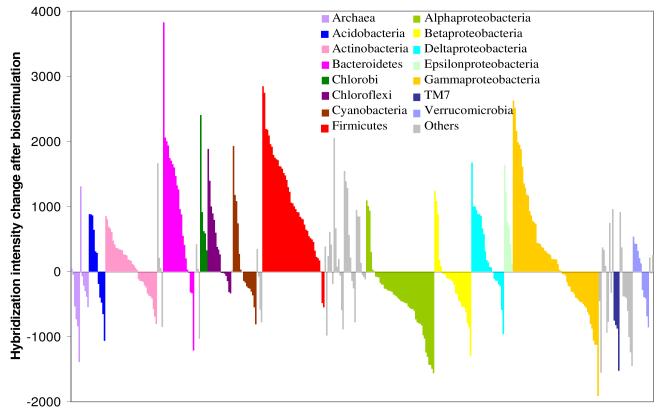
Figure 3.
Changes in hybridization intensity relative to the background sample of the 393 subfamilies immediately after biostimulation with whey (July 2005) in the treatment plot. Phyla are color-coded and ordered alphabetically from left to right starting with the archaeal domain followed by the bacterial domain. Each bar represents a subfamily with positive bars indicating subfamilies that increased in abundance relative to the background after receiving whey and negative bars represent subfamilies that decreased in abundance. A 1000-unit change in hybridization intensity is equivalent to a 10-fold change in relative abundance.

