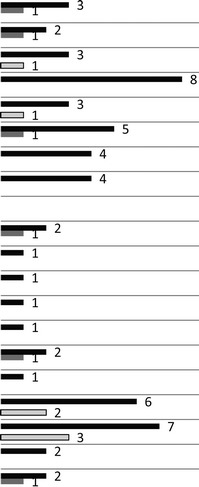
Table IV.
Treatment predictors of discontinuation.
| INITIATE | FIRST |
ART- FAILED | ART-FAILED and TYPICAL |
ART ALL | |||||||||||
|---|---|---|---|---|---|---|---|---|---|---|---|---|---|---|---|
| Eisenberg 2010 | Danesh- Meyer 1993 | Guerif 2002 | Guerif 2003 | Steures 2007 | Sharma 2002 | De Vries 1999 | Pearson 2009 | Pelinck 2007 | Roest 1998 | Rufat 1994 | Smeenk 2004 | Verberg 2008 | Verhagen 2008 |
 Nr studies investigating predictor Nr studies investigating predictor |
|
 Nr studies associating predictor with higher discontinuation Nr studies associating predictor with higher discontinuation | |||||||||||||||
 Nr studies associating predictor with lower discontinuation Nr studies associating predictor with lower discontinuation | |||||||||||||||
| Doctor censored patients excluded from analysis | No | No | Yes | Yes | No | No | No | No | No | No | No | Yes | No | No | |
| Predictors | |||||||||||||||
| Infertility history |  |
||||||||||||||
| Parity | NS | + | NS | ||||||||||||
| Pregnancies prior IVF | + | NS | |||||||||||||
| Previous fertility treatment | − | NS | NS | ||||||||||||
| Infertility duration | NS | NS | NS | NS | NS | NS | NS | NS | |||||||
| Primary infertility | − | NS | NS | ||||||||||||
| Male factor | NS | NS | NS | + | NS | ||||||||||
| Female factor | NS | NS | NS | NS | |||||||||||
| Unexplained/no diagnosis | NS | NS | NS | NS | |||||||||||
| Treatment | |||||||||||||||
| Time to treatment | + | NS | |||||||||||||
| Type of treatment | NS | ||||||||||||||
| Duration of treatment | NS | ||||||||||||||
| Nr visits to physician | NS | ||||||||||||||
| A priory estimated pregnancy rate | NS | ||||||||||||||
| Stimulation dosage | NS | + | |||||||||||||
| Cancelled cycle | NS | ||||||||||||||
| Oocytes retrievals | − | NS | NS | − | NS | NS | |||||||||
| Embryo fertilization, transfers & quality | − | NS | NS | − | NS | − | − | ||||||||
| Use frozen embryos | NS | NS | |||||||||||||
| Pregnancy lost/other comp | +a | NS | |||||||||||||
Note: Blank cells mean that the corresponding predictor was not investigated in the corresponding study; NS = non-significant statistical test; + = predictor associated with higher discontinuation; − = predictor associated with lower discontinuation; amoderation effect of treatment cycle between pregnancy lost/other complications and discontinuation, chemical pregnancy only (versus failed embryo implantation), cycle 1: 1.51 (95% CI 1.04–2.17), P = 0.03, cycle 2: 1.09 (95% CI 0.67–1.76), P = 0.74 and clinical pregnancy loss (versus failed embryo implantation), cycle 1: OR 1.88 (95% CI 1.22–2.90), P < 0.01, cycle 2: 0.95 (95% CI 0.52–1.72), P = 0.86.
INITIATE = during diagnosis, before initiation of treatment; FIRST = during first-order treatments like insemination or ovulation induction; ART-START = on the waiting list to start assisted reproductive techniques; ART-FAILED = after the first failed ART cycle; ART-TYPICAL = before completion of the typical ART regimen.
