
Figure 1.
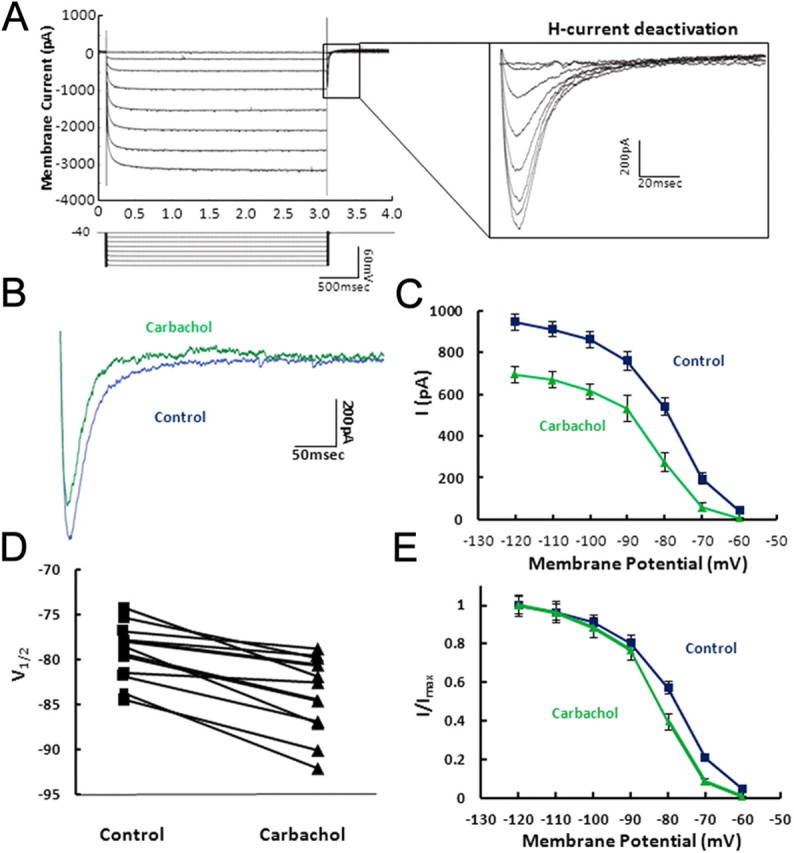
Analysis of Ih tail current magnitude in the presence and absence of carbachol. A, Ih tail currents were obtained using 3 s hyperpolarizing voltage steps starting from and returning to a holding potential of −40 mV. Inset, For each voltage step used to activate Ih, the tail current was measured as the difference between the minimum point of the tail current—that is the minimum point of the tail current observed after the step back to −40 mV—and the steady-state current value. B, Individual example tail currents are shown in control (blue) and after 10 min bath application of 10 μm carbachol (green). C, Population averages demonstrate that carbachol significantly decreases the tail current measured at −40 mV after stepping from a series of holding potentials (−120 to −50 mV). D, V1/2 values, generated using the fits in Figure 1D, are measured across individual cells for control (square) and for carbachol (triangle). E, Tail current activation curves obtained in control (blue square) and in the presence of carbachol (green triangle) are shown normalized to maximum current.