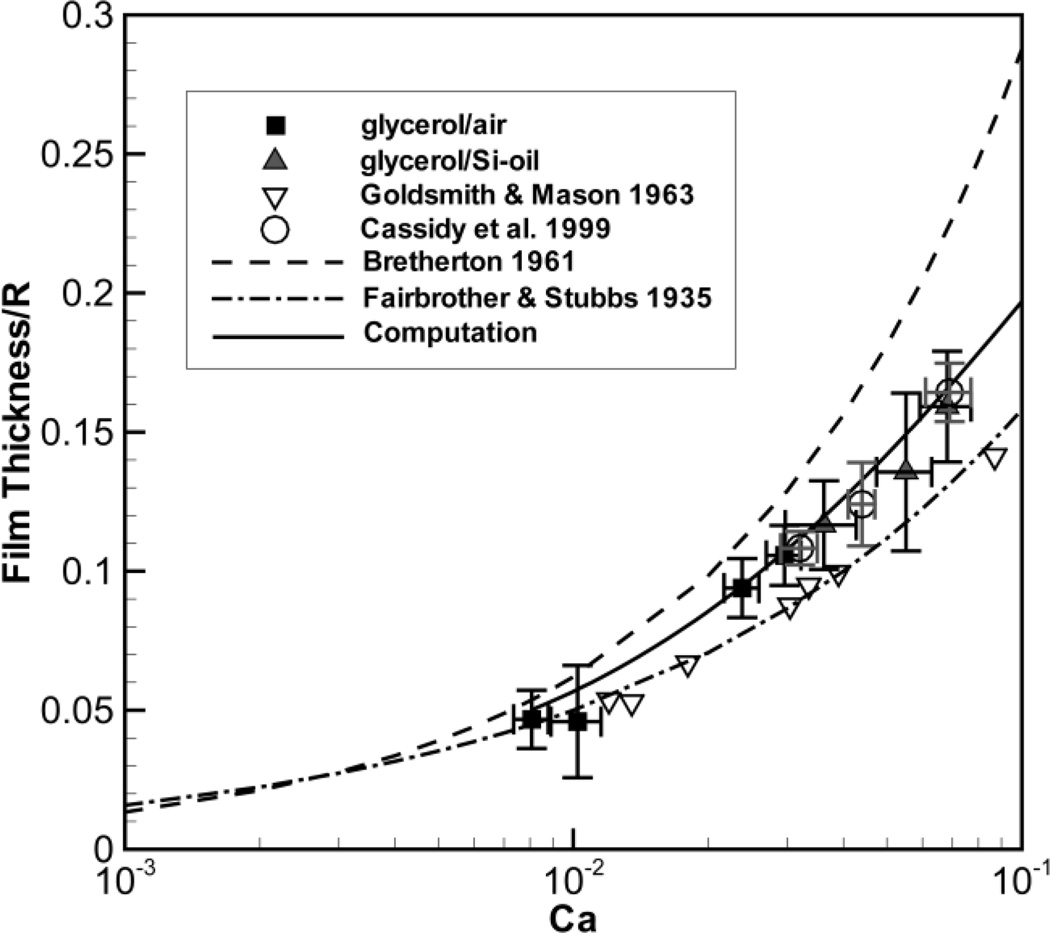
Fig. 8.
Direct measurement of normalized film thickness vs. Ca. Our results are plotted using filled squares (glycerol/air) and triangles (glycerol/Si-oil). The solid line shows computational results based on Smith and Gaver (2008), the dashed and dot-dash lines are analytical solutions (Bretherton, 1961; Fairbrother and Stubbs, 1935), and empty circles and empty deltas are experimental values (Cassidy et al., 1999; Goldsmith and Mason, 1963). Error bars on our experimental results indicate standard deviations of instantaneous film thickness (vertical) and Ca (horizontal) values.

