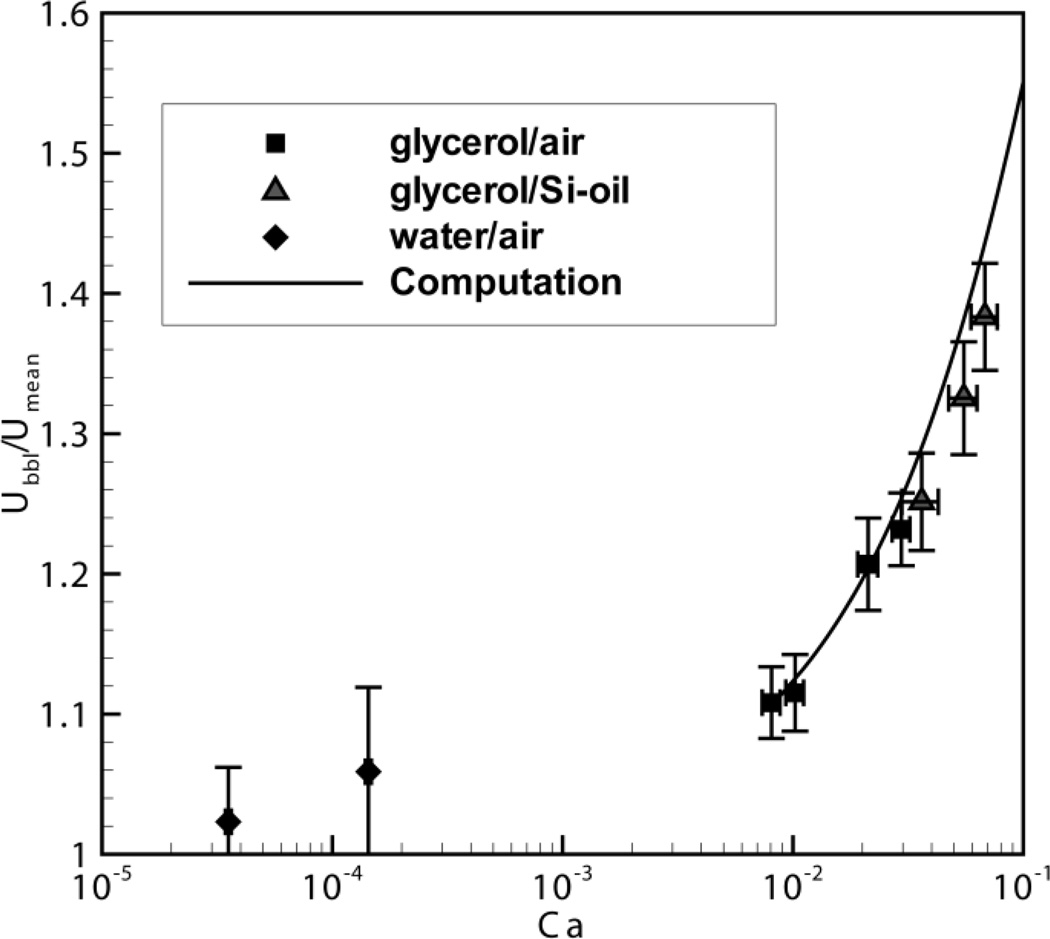
Fig. 9.
Direct measurement of normalized bubble tip velocity vs. Ca, where Ubbl is the measured bubble tip velocity and Umean is the average velocity of the fully developed region. Error bars indicate the standard deviations of instantaneous bubble velocity (vertical) and Ca (horizontal) values. The Solid line is the computational simulation based on Smith and Gaver (2008). The relatively wide margins of error for the water/air system are caused by the low signal-to-noise ratio around the bubble tip.

