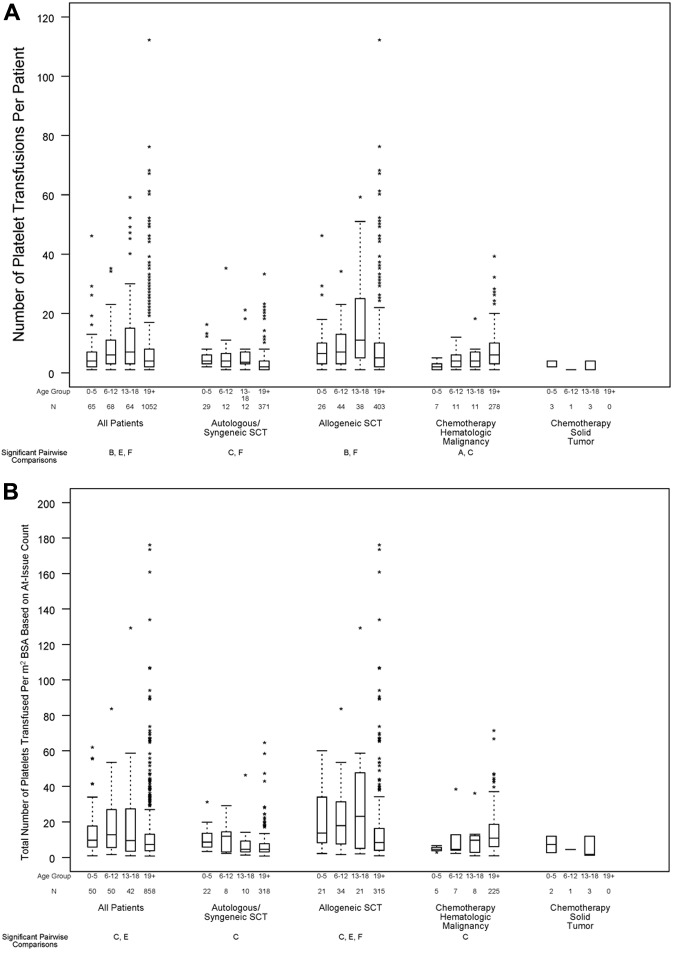
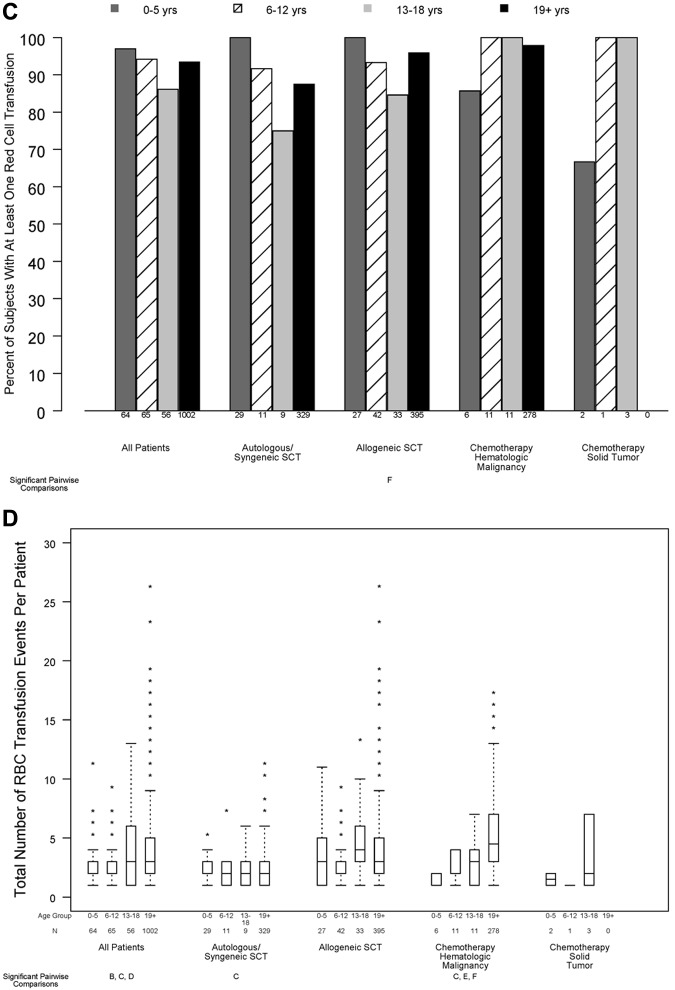
Figure 5.
Relation between age group and transfusion resource requirements, in all patients and within disease treatment category. Age group comparisons with pairwise P values < .05 are noted (A: 0-5 years vs 6-12 years; B: 0-5 years vs 13-18 years; C: 0-5 years vs ≥ 19 years; D: 6-12 years vs 13-18 years; E: 6-12 years vs ≥ 19 years; F: 13-18 years vs ≥ 19 years). (A) Number of platelet transfusions per patient (overall test for age group, P < .001; interaction between age group and disease treatment category, P < .001), (B) total number of platelets transfused per BSA, based on at-issue count (overall test for age group, P < .001; interaction between age group and disease treatment category, P < .001). (C) Percentage of patients who received ≥ 1 red cell transfusion (overall test for age group, P = .11; P for interaction not estimable), (D) total number of RBC transfusion events (overall test for age group, P = .045; interaction between age group and disease treatment category, P < .001).


