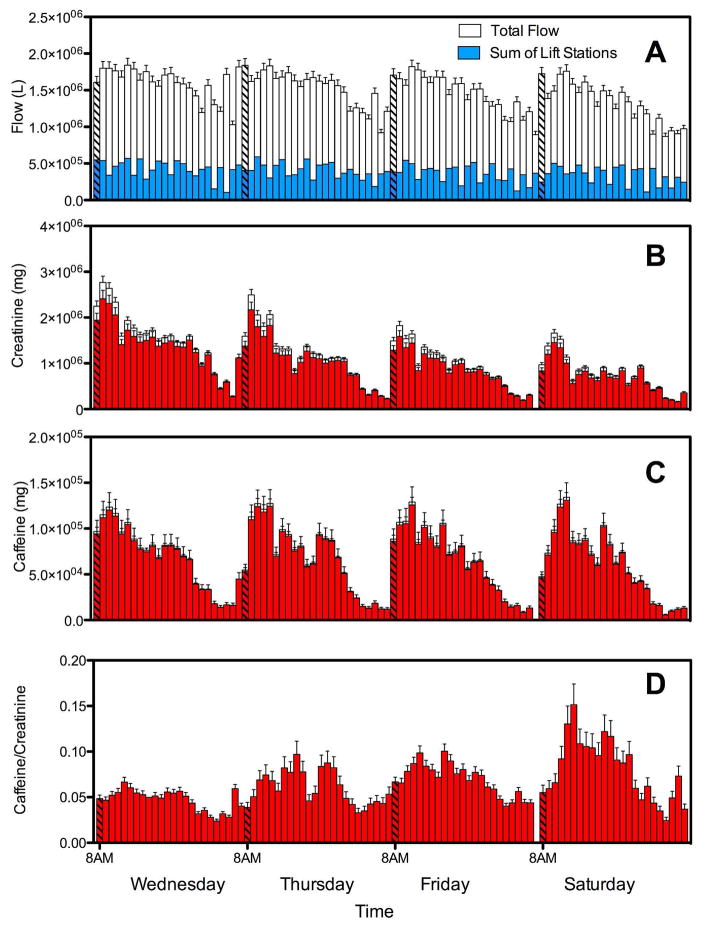
Figure 1.
Total hourly wastewater flows (gravity and pumped) from March 17th – March 21st (A), hourly loads (mg) of creatinine (B), caffeine (C), and caffeine/creatinine (D). Blue bars indicate sum of lift station wastewater flow. Red bars indicate measured load and the corresponding error (See SI for error calculations). Clear bars indicate the estimated load loss during collection and storage at 4 °C and the corresponding error calculated from the 95% CI of the rate constant measured during the stability study. Black hatched bars indicate 8 am as a time reference for each day.1
1The bottle collecting the 7–8 am sample on Saturday broke during collection.

