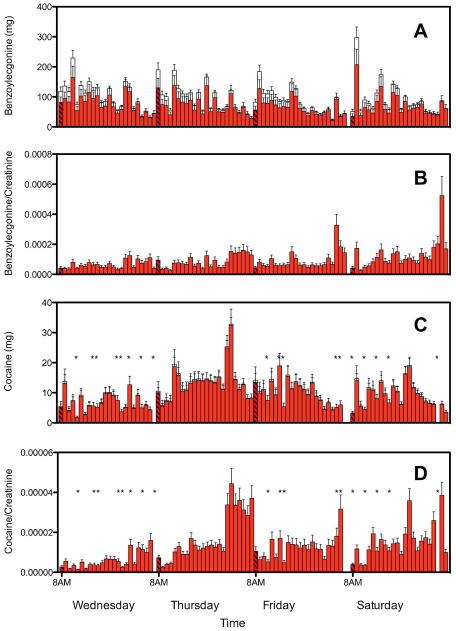
Figure 3.
Hourly load (mg) of benzoylecgonine (A), benzoylecgonine/creatinine (B), cocaine (C), and cocaine/creatinine (D) for Wednesday March 17th – Saturday March 21st. Colored bars indicate measured load and the corresponding error (See SI for error calculations). Clear bars indicate the estimated load loss during collection and storage at 4 °C and the corresponding error calculated from the 95% CI of the rate constant measured during the stability study. Black hatched bars indicate 8 am as a time reference for each day.1
1The bottle collecting the 7–8 am sample on Saturday broke during collection.
*Samples with signal-to-noise ratios <10 determined from calibration curves are included for qualitative purpose.

