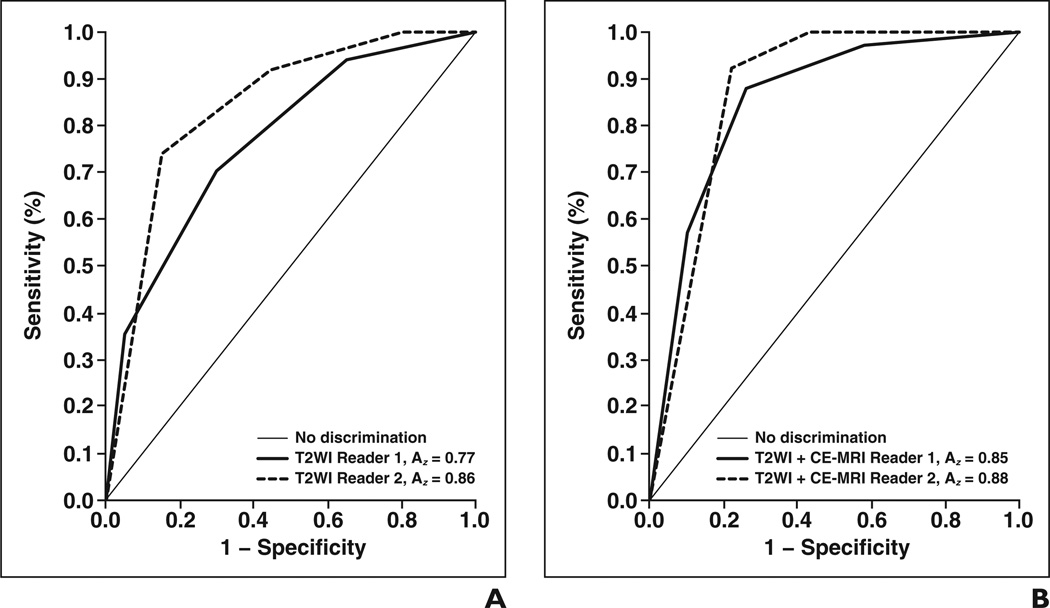
Fig. 1.
Receiver operating characteristic (ROC) curves.
A and B, Graphs show accuracy of reader 1 and reader 2 for T2-weighted imaging (T2WI) alone (A) and T2WI plus contrast-enhanced MRI (CE-MRI) (B). With addition of CE-MRI, area under ROC curve (Az) increased significantly for reader 1 (p = 0.0435) but not for reader 2 (p = 0.7294). Curves reflect that adding CE-MRI improves interobserver variability. Sensitivity is defined as true-positive rate, and 1 − specificity is defined as false-positive rate.

