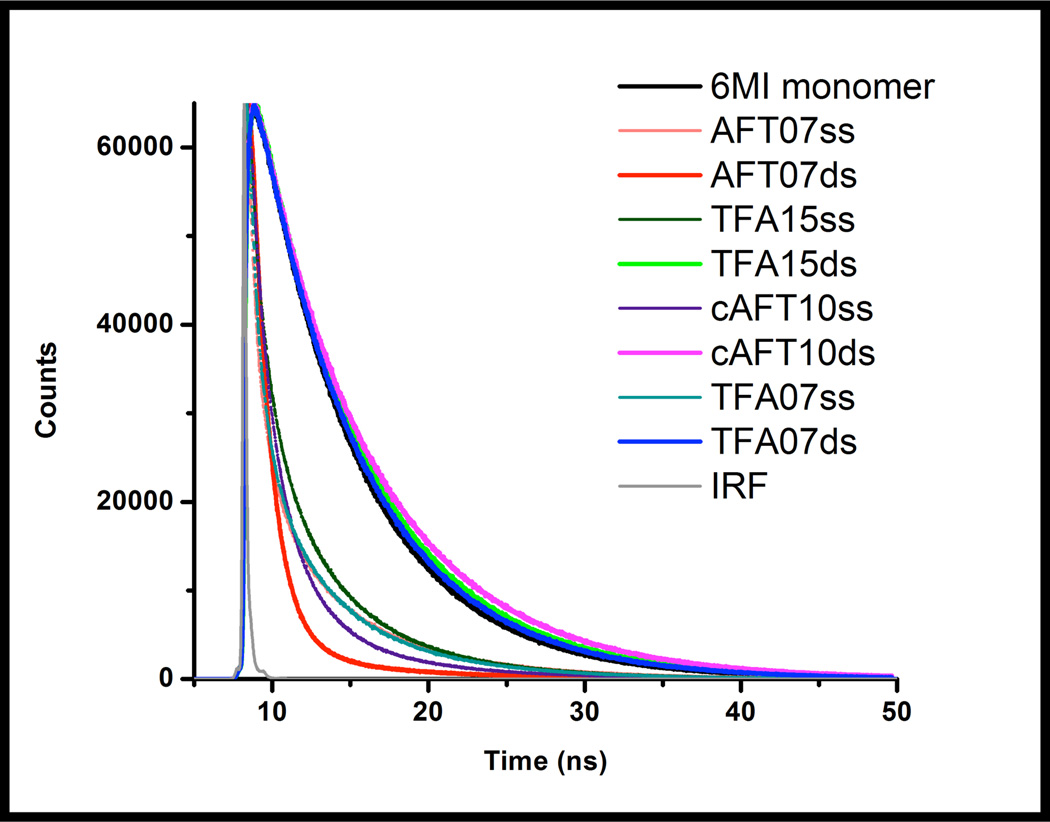
Figure 4.
Fluorescence lifetime decay curves (ex=375, em=460) of 6-MI containing ssDNA and dsDNA molecules compared to monomer (black). Dynamic quenching of 6-MI occurs upon incorporation into ssDNA oligomers, as revealed by significantly faster decays (brown, dark green, pink, teal). The dsDNA molecules containing either the ATFAA or AAFTA sequences (TFA15ds-green, TFA07ds-blue, and cAFT10ds-magenta) exhibit fluorescence decays similar to 6-MI monomer (black), indicative of a lack of quenching. Notably, the AFT07 duplex exhibits a fast decay (red). The instrument response function is shown in gray.

