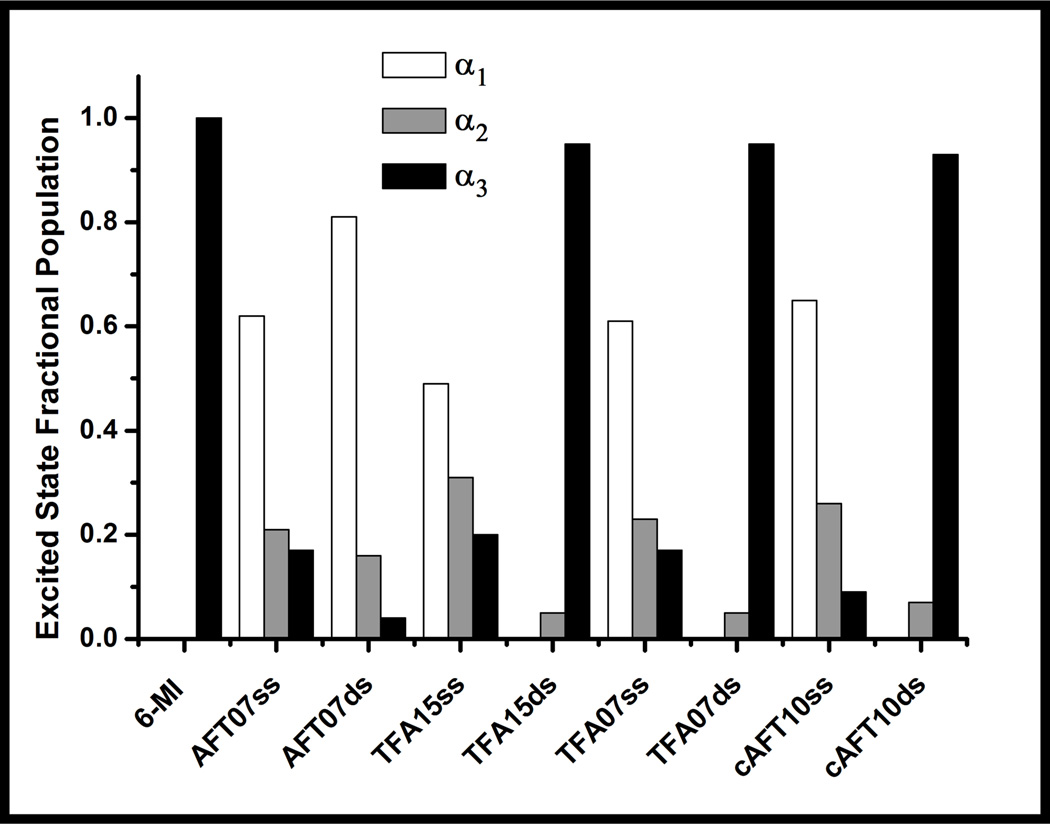
Figure 5.
Fractional populations determined from time-resolved fluorescence decay curves (shown in Figure 4) of 6-MI-containing ssDNA and dsDNA molecules relative to monomer. Duplex formation leads to a shift in the peak population to the longest lifetime component (α3) for sequences containing either the ATFAA or AAFTA sequence (TFA15ds, cAFT10ds, TFA07ds). For ssDNA oligomers, the largest fractional population is associated with the shortest- lived component (α1). The AFT07 duplex exhibits a population distribution similar to the single strands where the largest population is associated with the shortest-lived component (α1).

