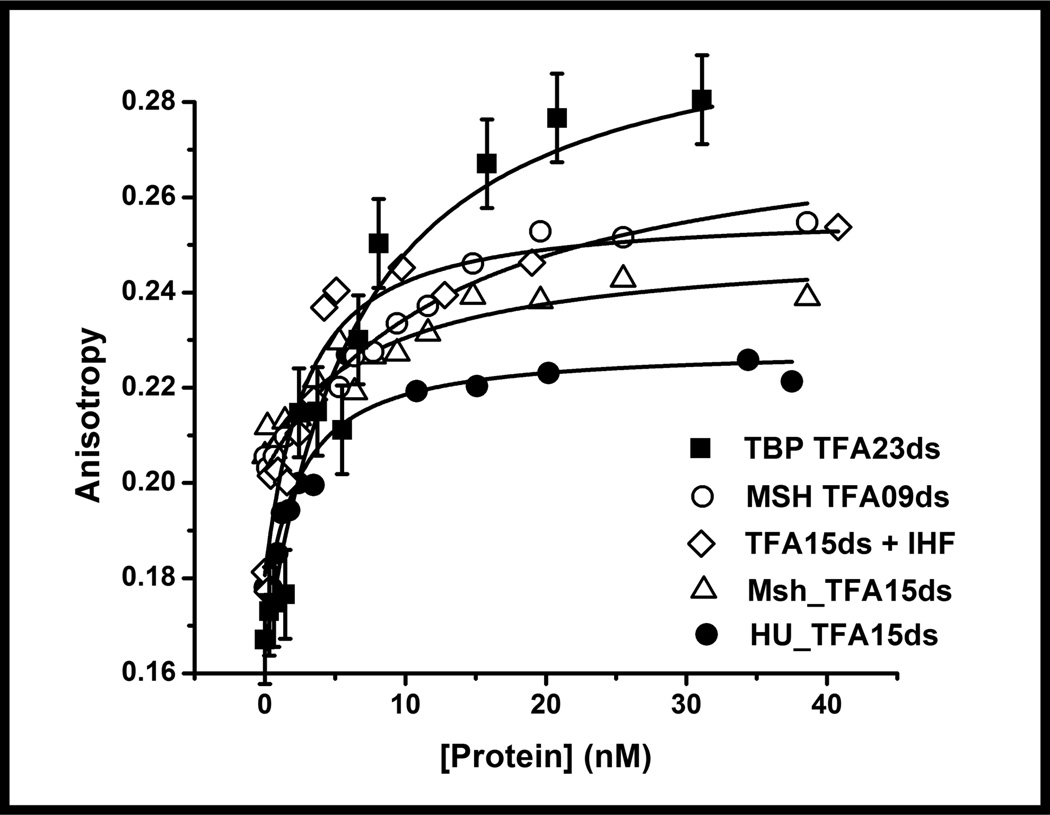
Figure 7.
The equilibrium fluorescence anisotropy binding curves show the versatility and sensitivity of the ATFAA sequence, where only 1 nM DNA is needed to accurately measure equilibrium binding affinity of four different protein-DNA complexes. Proteins investigated include sequence specific DNA binding proteins (IHF, TBP) and non-sequence specific DNA binding proteins (Msh2-Msh6, HU). The 6-MI was excited at 340 nm and emission was detected at 440 nm. Representative error bars are shown on the TBP-DNA binding curve; the other curves have similar error.

