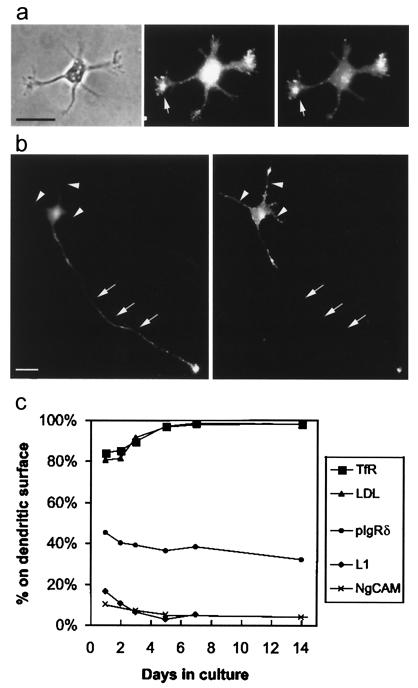
Figure 1.
Changes in the degree of polarization of axonal and dendritic markers during development. (a) In stage 2 neurons, axonal and dendritic markers are not segregated into different neurites. The micrographs illustrate a cell (phase, Left) from a 1-day-old culture 18 h after coinfection with adenoviruses encoding untagged versions of NgCAM (an axonal marker) and LDLR (a dendritic marker). At this stage, labeling of cell surface NgCAM (Center) and LDLR (Right) was primarily observed in the growth cones (arrow). Although the extent of staining varied among different neurites, both the axonal and dendritic markers tended to be concentrated in the same neurites. (Bar, 25 μm.) (b) In stage 3 neurons, axonal and dendritic markers have a complementary distribution, indicating their polarization to different neurites. The micrographs illustrate a stage 3 cell from a 1-day-old culture 18 h after coinfection with NgCAM- and LDLR-encoding adenoviruses. Labeling of cell surface NgCAM (Left) showed a strong polarization to the axon (arrows), including its growth cone, whereas staining of the short dendritic processes (arrowheads) was largely absent. In contrast, cell surface staining of LDLR (Right) was prominent in cell body and dendrites but nearly absent from the axon. (Bar, 25 μm.) (c) As a measure of polarization, we quantified the percentage of staining for each marker protein that was associated with the dendritic arbor. The dendritic proteins TfR and LDLR were already preferentially localized to the dendritic arbor on day 1, and their polarization increased to mature levels by day 5. Likewise, the axonal proteins NgCAM and L1 were preferentially excluded from the dendrites on day 1; their polarization was essentially complete by day 5. A pIgR construct whose sorting signal had been mutated (pIgR665–668) served to illustrate the distribution of an unsorted protein. The percentage of this protein associated with the dendritic membrane decreased slightly during development, paralleling the relative increase in size of the axonal arbor. TfR and pIgR685–668 were expressed with replication defective herpesviruses and LDLR and NgCAM with replication defective adenoviruses. L1 is an endogenous protein. Each point represents data from 10–20 cells examined 12–18 h after infection.

