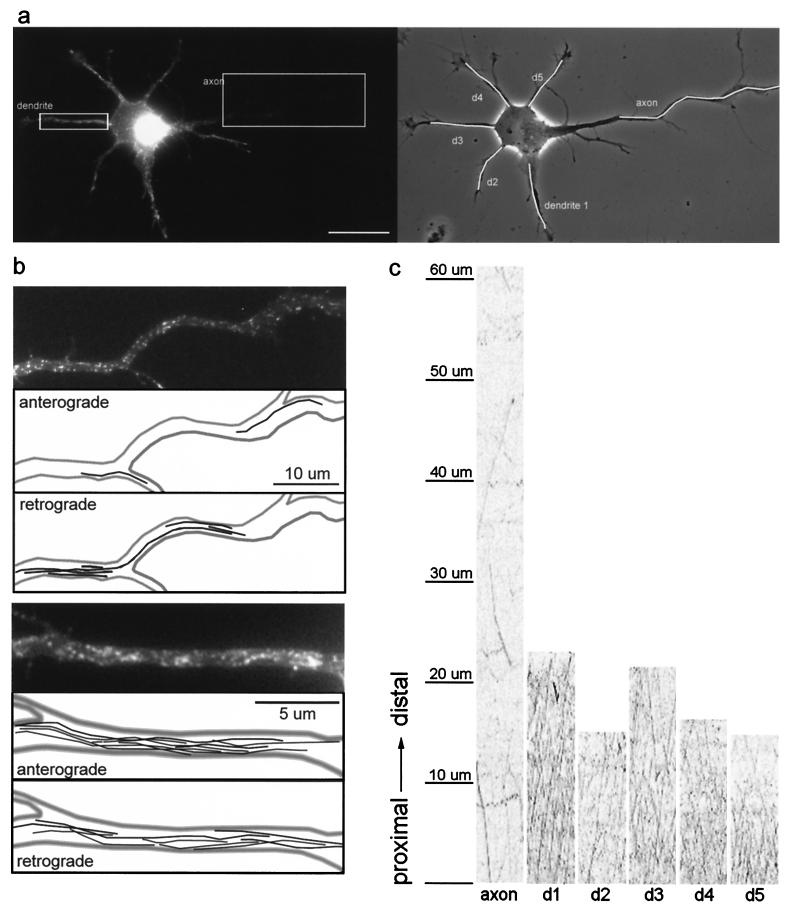
Figure 4.
Comparison of the transport of TfR-GFP carrier vesicles in axons and dendrites of stage 3 cells. (a) A stage 3 neuron expressing TfR-GFP (Right, phase contrast; Left, GFP fluorescence); note the higher level of TfR-GFP fluorescence in the dendrites compared to the faint fluorescence in the proximal axon. Vesicle transport in this cell was recorded over a period of 30 sec, capturing images every 600 msec. Movies 1–4 of these data are published as supplemental data on the PNAS web site, www.pnas.org. (Bar, 20 μm.) (b) Vesicle transport in the proximal axon (Upper) and a representative dendrite (Lower). The topmost panel shows an enlarged view of the axonal segment (boxed in a). The path of each vesicle that moved in the anterograde direction or the retrograde direction during the 30-sec recording is shown in the two succeeding panels. Lower shows an enlarged view of one dendrite (boxed in a), followed by the path of each vesicle that moved in the anterograde and retrograde directions. Many more vesicles travel into the dendrite than the axon. To enable the visualization of faint vesicles in the axon, contrast was enhanced relative to the dendrite. (c) To quantify transport, recordings from TfR-GFP-expressing cells were analyzed by using kymographs, which show anterogradely moving vesicles as diagonal lines with positive slope, whereas retrogradely moving vesicles are represented by lines with negative slopes. This analysis revealed that there is extensive anterograde vesicle traffic into each dendrite but few transport events in the axon.

