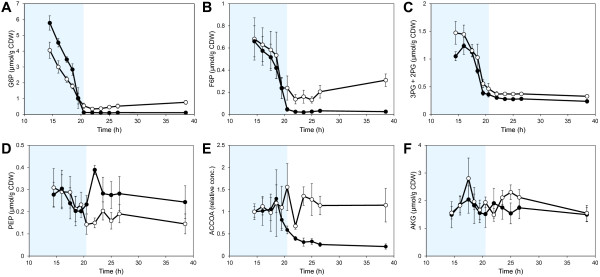
Figure 5 .
Dynamics of important precursor metabolites. Intracellular concentrations of A) G6P, B) F6P, C) the combined pool of 2PG and 3PG, D) PEP, E) ACCOA and F) AKG during anaerobic batch fermentation of 20 g/L glucose and 40 g/L xylose using strains TMB3057 (XR/XDH, white markers) and TMB3359 (XI, black markers). Errors are given as 95% confidence intervals of the means calculated from duplicate experiments for each strain (4 ≤ n ≤ 10). The shaded area indicates the period until glucose depletion. The levels of ACCOA are calculated relative to the first time point at 14.5 h. The shaded area indicates the period until glucose depletion.

