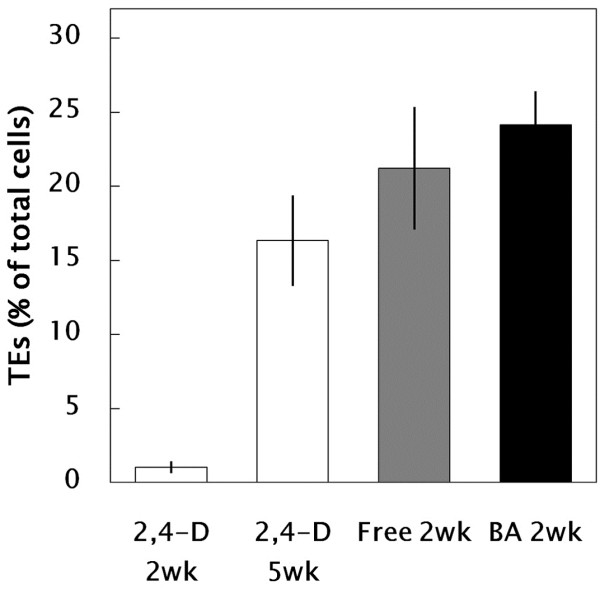
Figure 6.

Effect of culture conditions on differentiation of TEs (2,4-D: m1/2MS + 3 μM 2,4-D; Free: m1/2MS – phytohormones; BA: m1/2MS + 10 μM BA). A portion (ca. 20 μl) of suspension cells that contained ca. 50–100 cells in total was mounted on a glass slide and the number of TEs in the sample was counted under a microscope. All data are expressed as mean ± SE (n = 18).
