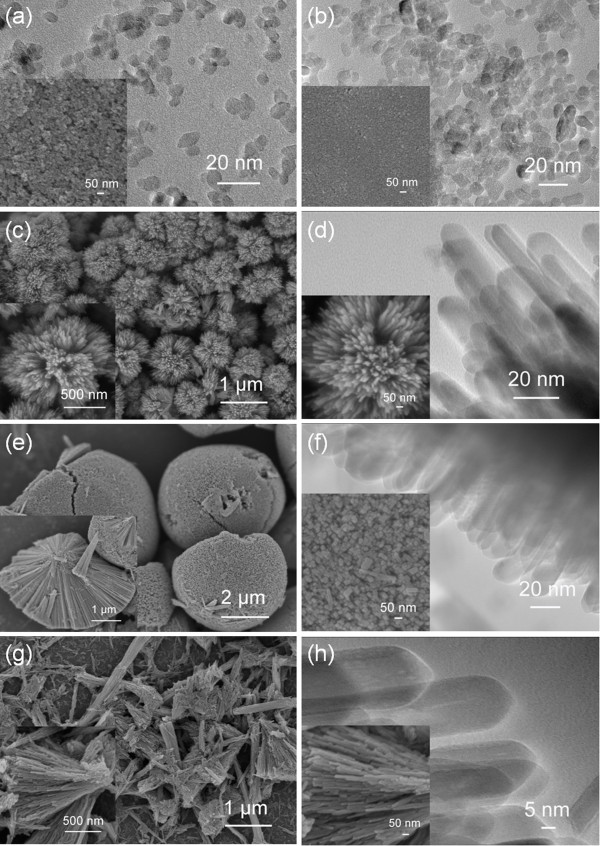
Figure 6.
Typical FESEM and TEM images of the products. Products synthesized at various HCl concentrations: (a) 0, (b) 0.45 M, (c and d) 0.68 M, (e and f) 1.12 M and (g and h) 1.35 M. (c), (e), and (g) are overview FESEM images. (d), (f), (h) and the insets are enlarged TEM and FESEM images of the surfaces of the corresponding samples.

