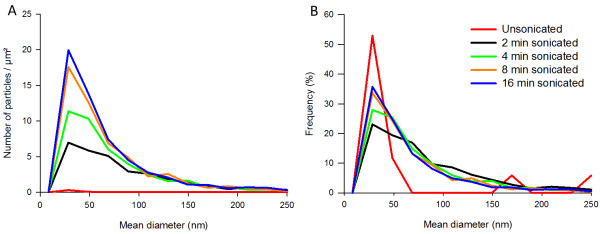
Figure 2.
Number-based size distributions visualising the effect of sonication on the size distribution of the precipitated silica NM-200. The number of particles per μm² of grid area for a concentration of 0.512 mg/ml ( A) and the corresponding frequencies ( B) for unsonicated (Red), 2 min (Black), 4 min (Green), 8 min (Orange) and 16 min (Blue) of sonication, are represented as a function of their mean diameter.

