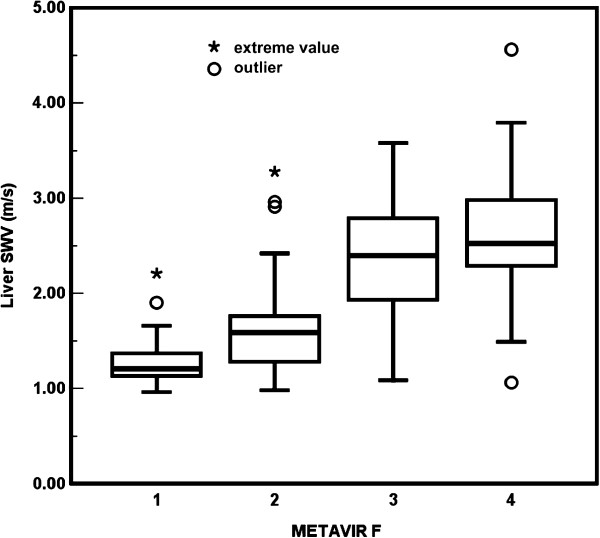
Figure 3.
Box plot of liver stiffness corresponding to the METAVIR fibrosis (F) stages. The overall inter-group difference of liver shear wave velocity (SWV) among METAVIR F1 to F4 was significant (P < .001). Pair-wise comparisons also showed significant differences between groups: all P < .001, except P = .412 for F3 versus F4.

