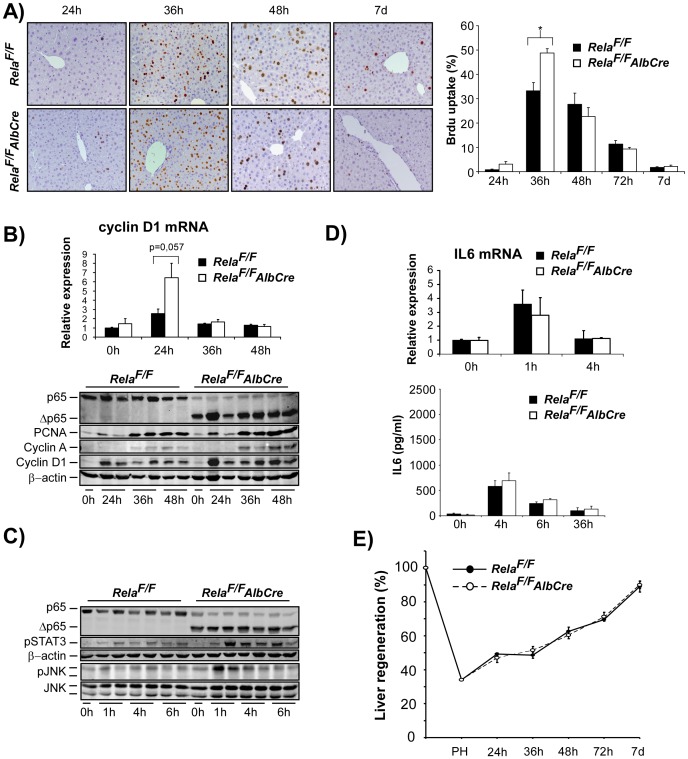
Figure 2. Hepatocyte-specific inactivation of RelA/p65 results in accelerated cell cycle progression without altering liver mass regeneration after 2/3 PH.
(A–E) 2/3 PH was performed in RelaF/FAlbCre and RelaF/F control animals. (A) DNA synthesis was assessed by hepatocyte BrdU labelling at the indicated time points and quantified as described in Methods (representative×200 anti-BrdU stained liver sections are shown in the left panel, n = 4−8 animals per time point and group were counted for quantification, right panel). (B) Accelerated cell cycle progression in RelaF/FAlbCre mice as determined by mRNA levels of Cyclin D1 24 h post PH (upper panel) and WB analysis of cell-cycle associated proteins (PCNA, Cyclin A, Cyclin D1). Lysates were controlled for effective deletion of WT-RelA/p65 and β-actin served as loading control. Two representative lysates from each time point post PH are shown. (C) Loss of hepatocyte RelA/p65 leads to enhanced phosphorylation of STAT3 and JNK during the first hours after PH as assessed by immunoblot analysis (upper panels). (D) Liver IL-6 mRNA induction as determined by RT-PCR (upper graph) and IL-6 serum levels (ELISA, lower graph) were not different between groups. (E) Liver mass regeneration (%) determined as described in Methods did not differ between the groups. Data from BrdU-labelling, cytokine analysis, RT-PCR, and analysis of liver mass regeneration are presented as the average ± SEM for 3–6 animals per time point per group. *, p≤0.05 for mutant vs. control mice.

