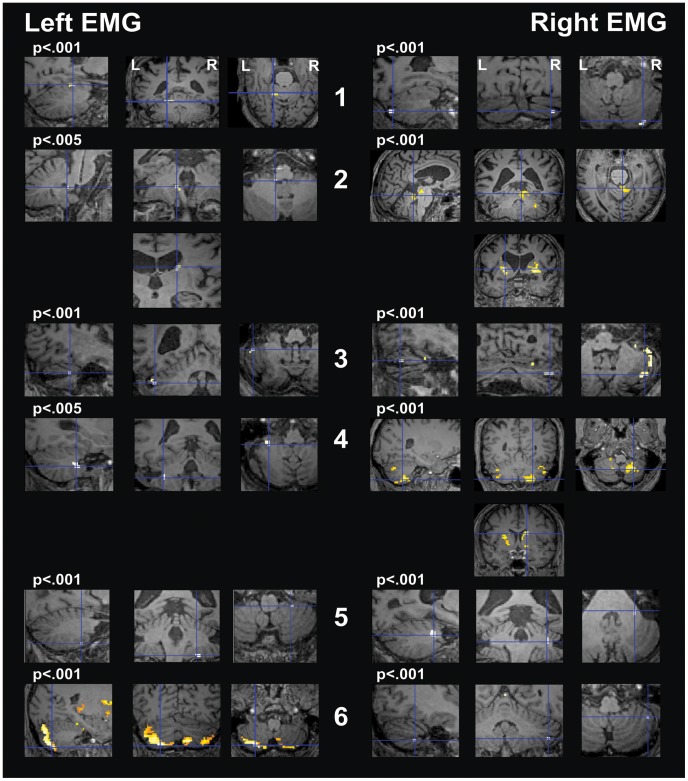
Figure 2. Single-subject analysis for protocol “Tremor” with the “Circuit mask”.
The right hemisphere is represented on the right (“neurological view”). SPM t-contrasts, superimposed on the subjects’ own T1, are shown at a threshold of p<.001 uncorrected. For patient No. 2 and 4, Left EMG, no activity was seen at this threshold: for explorative purpose, these scans are shown at a threshold of p<.005 (p value indicated in the figure above the corresponding images). The crosshair points to the global maxima. Panels on the left show activity related to left EMG during left arm stretching (non-operated side). Ipsilateral cerebellar activation is present in all the patients except for patient 5. In four patients (No. 1, 3, 4, and 6) this represented the maximal activity, while in patient No. 2 the maximal activity was in the right caudate. In patient No. 5 the maximal activity was located in the right cerebellum and there was no clear activation of the left cerebellum. Panels on the right show activity related to right EMG during right arm stretching (operated side). Ipsilateral cerebellar activation is present in all patients. In patient No. 4 activity was maximal in the right caudate and in patient No. 2 in the left putamen.

