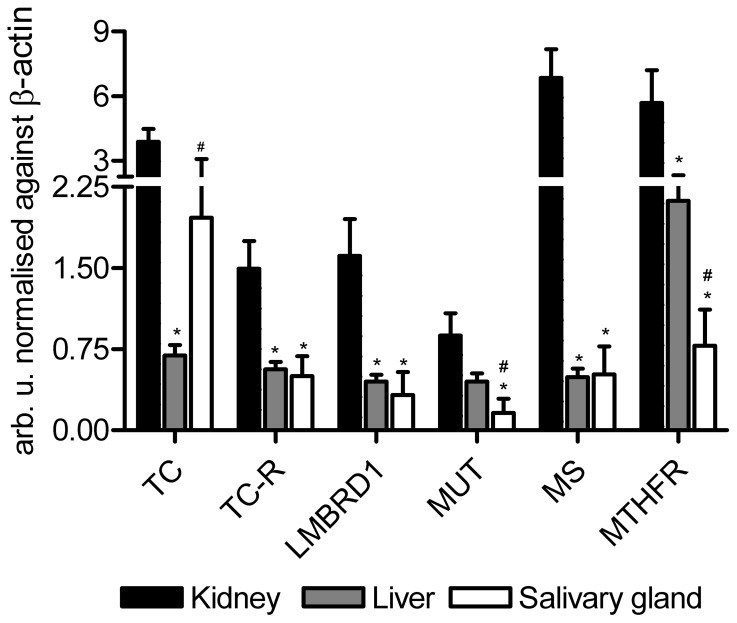
Figure 2. Transcript levels of selected genes involved in B12 metabolism in mice.
The columns shown mean (+SEM) mRNA levels determined by quantitative reverse–transcriptase (q–rt–) PCR and normalised against β–actin in kidney, liver, and salivary glands of control mice (n = 7 mice of each tissue). Arb.u.: Arbitrary units. LMBRD1: lysosomal B12 transporter. MS: methionine synthase. MTHFR: methylenetetrahydrofolate reductase. MUT: methylmalonylCoA mutase. TC: transcobalamin. TC–R: TC–receptor. Wilcoxon tests were carried out between kidney and liver or salivary glands (*p<0.05) as well as between liver and salivary glands (#p<0.05).

