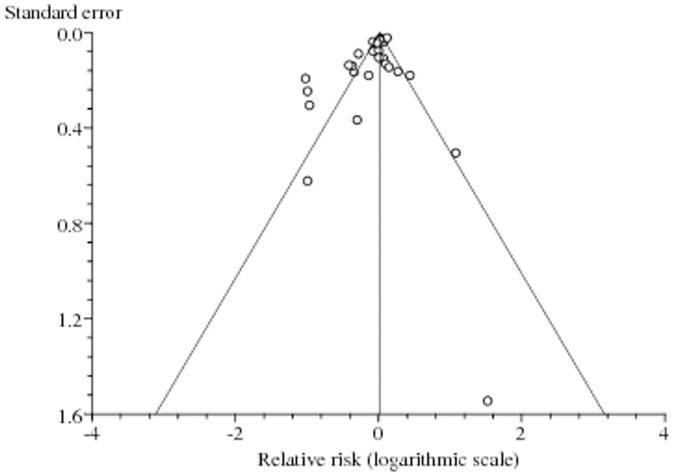
Figure 2. Assessment of publication bias.
Funnel plot (publication bias assessment plot) of the relative risk of developing prostate cancer, by the standard error, for all studies. Circles- studies included in the meta-analysis. Relative risks are displayed on a logarithmic scale. p = 0.56 for the Begg's test, and p = 0.12 for the Egger's test.

