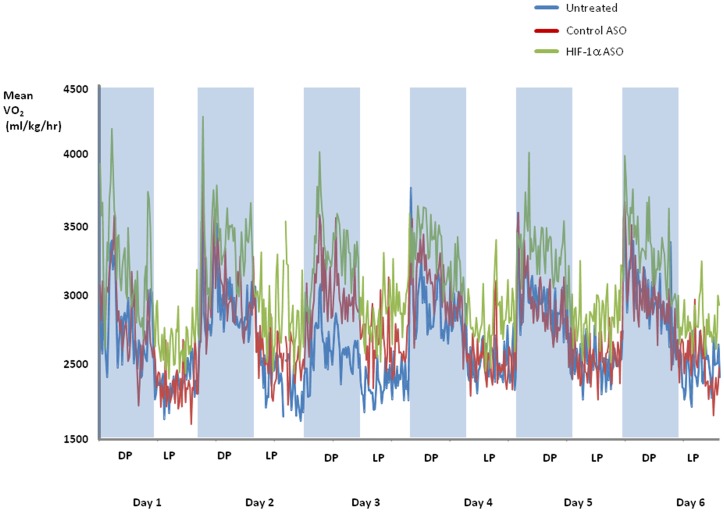
Figure 4. O2 consumption (VO2) has been analyzed every 16 min for 6 consecutive days in DIO mice treated with HIF-1α ASO, control ASO or observed untreated.
Shaded areas represent the 12 hr dark phase (DP) and unshaded areas represent the 12 hr light phase (LP). VO2 in HIF-1α ASO treated mice significantly exceeded VO2 in mice treated with control ASO and untreated mice, p<0.001. VO2 during the dark phase significantly exceeded those during the light phase, p<0.001.

