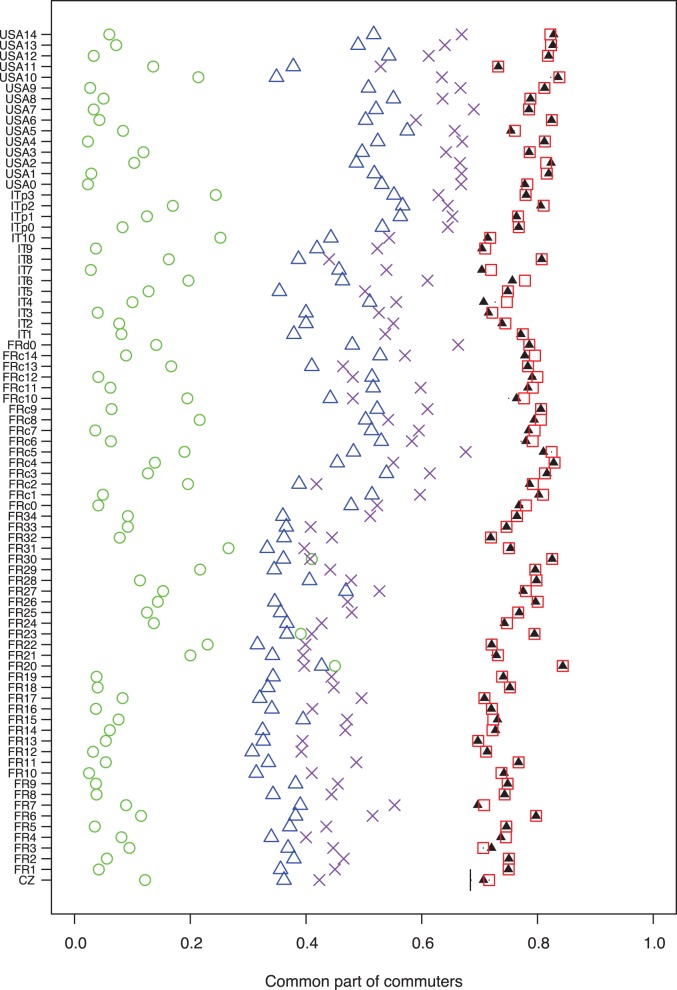
Figure 3. Common part of commuters (CPC) for the 80 case-studies.
The red squares represent the CPC obtained with the value of  optimised from data on the case-study network. Black plain triangles represent the average CPC obtained with
  values estimated with the rule linking
  and the average surface of the units obtain with the cross-validation; Dark bars represent the minimum and the maximum CPC obtained with the estimated
  but in most cases they are too close to the average to be seen. The green circles represent the CPC obtained with the random model. The blue triangles represent the CPC obtained with the radiation model. The purple crosses represent the CPC obtained with the modified version of the radiation model.

