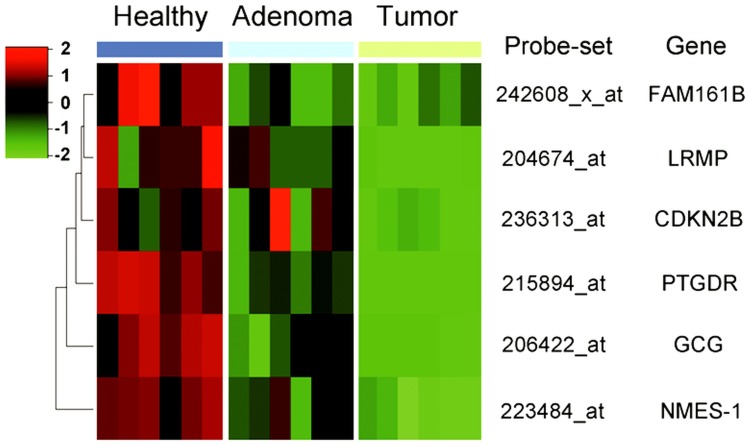
Figure 2. Differential expression of six selected genes in normal colonic epithelial samples, adenoma, and tumor samples.
Expression of the tumor suppressor gene CDKN2B is shown for comparison. Probe set identification codes and gene names are indicated on the right. The six columns indicate microarray results obtained from six individual samples for each type of tissues. Black squares indicate that gene expression was unchanged in that experiment. The degree of intensity of red or green indicates the level of gene expression high or low, respectively.

